


-- Subscribe to Jamie Saettele's distribution list in order to receive a free report to your inbox several times a week.
--For more analysis and trade setups (including current positions and the ‘watchlist’), visit SB Trade Desk
--Free trading tips
Weekly

Chart Prepared by Jamie Saettele, CMT
See REAL TIME trader positioning
High Frequency Trading Tools
-FXTW wrote in early May that “EUR/USD broke through (resistance) on an intraweek basis but finished the week with a long upper wick that warns of a ‘bull trap’. It seems right to be (long term) bullish given the 31 year trendline support but the breakout may have to wait a bit. As always, define your risk points (read more about traits of successful traders here). FXTW was also of the mind however that the May low at 1.1097 would hold…then Brexit happened. A broad view reveals that nothing has really changed however. Price is still above the long term trendline and price action since March 2015 closely resembles the early 2000s bottoming process.
-For forecasts and 2016 opportunities, check out the DailyFX Trading Guides.
GBP/USD
Monthly

Chart Prepared by Jamie Saettele, CMT
See REAL TIME trader positioning
-The last update noted that “in the run-up to the BREXIT vote, Cable has traded in a volatile range between 2 long term parallels. A break of one of these parallel should usher in the next directional move, either to 1.27 or 1.58. Confidence in directional is low until the headline issue is resolved. Remember, there is a 96 month (8 year) cycle low count.” The issue was resolved and the market has cast its vote in favor of 1.27.
Weekly

Chart Prepared by Jamie Saettele, CMT
See REAL TIME trader positioning
-There is no change to the weekly AUD/USD analysis. “AUD/USD is constructive because former support turned resistance was support again several weeks ago (from a parallel). What’s more, this week’s low registered a few ticks above the opening price for the year (we call this the ‘touch and go’ over at SB Trade Desk). The next decision point may be above .7700 (the next parallel).”
NZD/USD
Weekly

Chart Prepared by Jamie Saettele, CMT
See REAL TIME trader positioning
-The last NZD/USD weekly update noted that “the ‘general area’ of resistance probably extends a bit above .7200. Watch this video for additional details.” NZD/USD traded to .7289 in late June before declining sharply. A long term parallel and major horizontal levels (including the 1988 high) could cap the rally from August 2015 while a break above this level would be a significant development. Bottom line, the current juncture commands attention as a major decision point.
Weekly
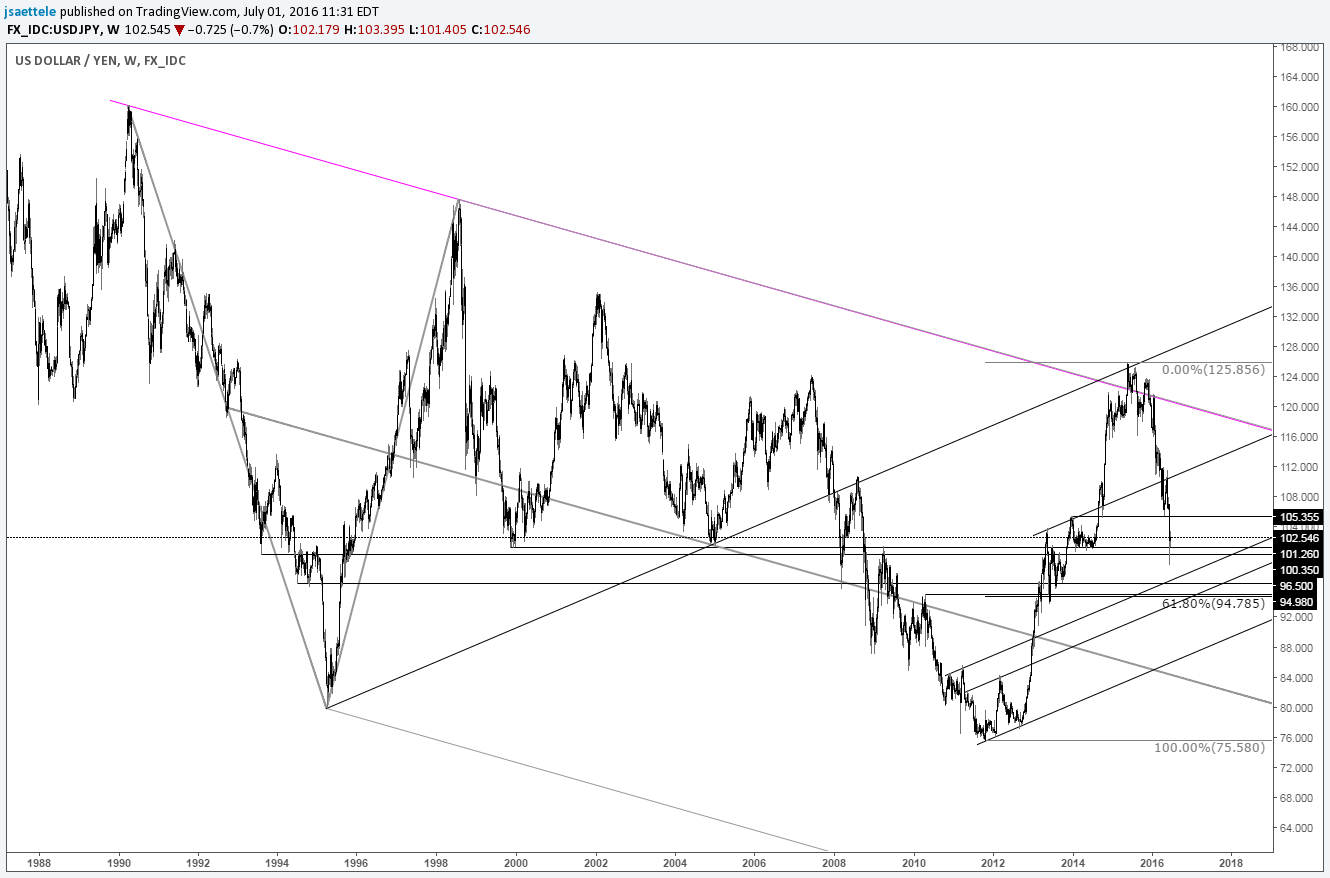
Chart Prepared by Jamie Saettele, CMT
See REAL TIME trader positioning
-USD/JPY is in freefall. FXTW thought that the low at 103.56 would prove more significant given the presence of the May 2013 high at 103.74 but also noted that “the next level of interest would not be until the 2000 and 2014 lows at 100.74-101.26.” Much to the chagrin of the technician (but not the trader…), a ‘shock’ event resulted in panic below 99! Price has stabilized in the vicinity of the noted 2000 and 2014 lows but whether or not the last week is a pause or a change in trend is unanswerable. Strength above 105.40 is needed in order to suggest that the upside is again viable. Until then, the area around 95 (next historical inflection point and 61.8% of rally from 2011) looms as a magnet.
Weekly

Chart Prepared by Jamie Saettele, CMT
See REAL TIME trader positioning
-Previous comments noted that “USD/CAD has carved a bullish engulfing candle at major support. The low just made could be significant.” The bullish engulfing is still there of course but the rally has failed at the 55 week average. FXTW pays attention to this because this average was support for the last 3 years. Former support just provided resistance so USD/CAD may be transitioning to a bearish phase.
Weekly

Chart Prepared by Jamie Saettele, CMT
See REAL TIME trader positioning
-FXTW was following a bullish wedge pattern from the November high. This pattern completed on 5/18. The pattern then failed on 6/6. A failed bullish pattern serves as a bearish warning. In fact, FXTW wrote recently that “a failed wedge would not be a surprise given the struggle at LONG TERM resistance since November.” Weakness below .9440 could usher in a ‘waterfall decline’.
Bonus Chart
Silver / Gold Monthly

-Bonus charts over the last 7 months have focused primarily on the return of the ‘inflation trade’. The Big Kahuna in all of this is the blow-off in bonds, which you can read about here. The turn higher in the silver/gold ratio is yet another indication that inflation trends have experienced an important shift (Market Anthropology has been addressing this issue for an extended period of time as well). Inflationary and deflationary forces are a product of the human condition and as such exhibit cycles at varying degree. In fact, the turn higher in this ratio is consistent with the length in time between previous troughs. The consistent cycle is remarkable considering that CBs have gone to great lengths to suppress natural order. Of course, to those that understand markets abide by their own natural rhythms, the cyclical reaction in this ratio is normal. Echoing Jean-Baptiste Alphonse Karr, “The more things change, the more they stay the same.”


