


- EUR/USD testing double bottom neckline
- GBP/USD follows through on breakout
- AUD/USD follows through on reversal
-- Subscribe to Jamie Saettele's distribution list in order to receive a free report to your inbox several times a week.
--For more analysis and trade setups (including current positions and the ‘watchlist’), visit SB Trade Desk
--Free trading tips
Weekly
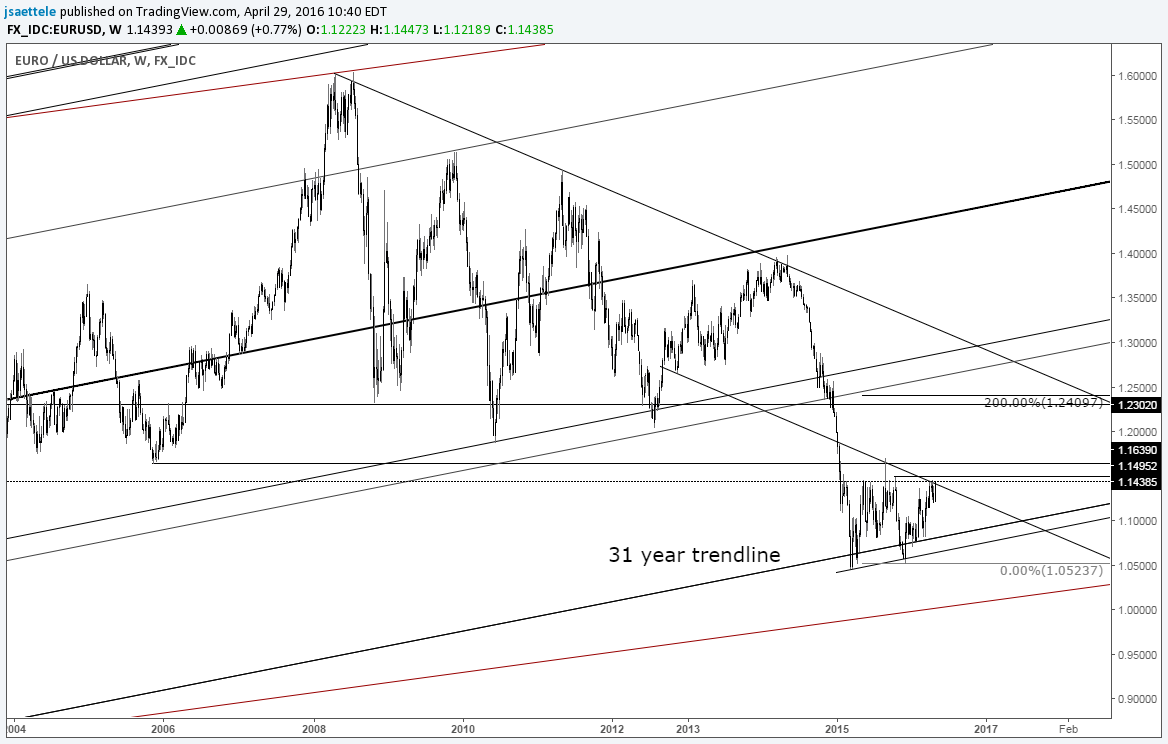
Chart Prepared by Jamie Saettele, CMT
See REAL TIME trader positioning
-“The importance of the current juncture in EUR/USD cannot be understated. If resistance from a parallel (August high) and horizontal levels gives way, then EUR/USD could trade to the mid-1.20s, and maybe quickly given that the rate had held a 3+ decade trendline for over a year. The key word in that sentence is ‘if’. A bearish outside week just formed at the combination of parallel and horizontal resistance so respect potential for renewed weakness.” After following through on a bearish outside week, EUR/USD rallied every day this week. We’re back at resistance, which is also the neckline from a 14 month double bottom. A break higher would complete the pattern and set an objective near 1.24.
-For forecasts and 2016 opportunities, check out the DailyFX Trading Guides.
GBP/USD
Weekly
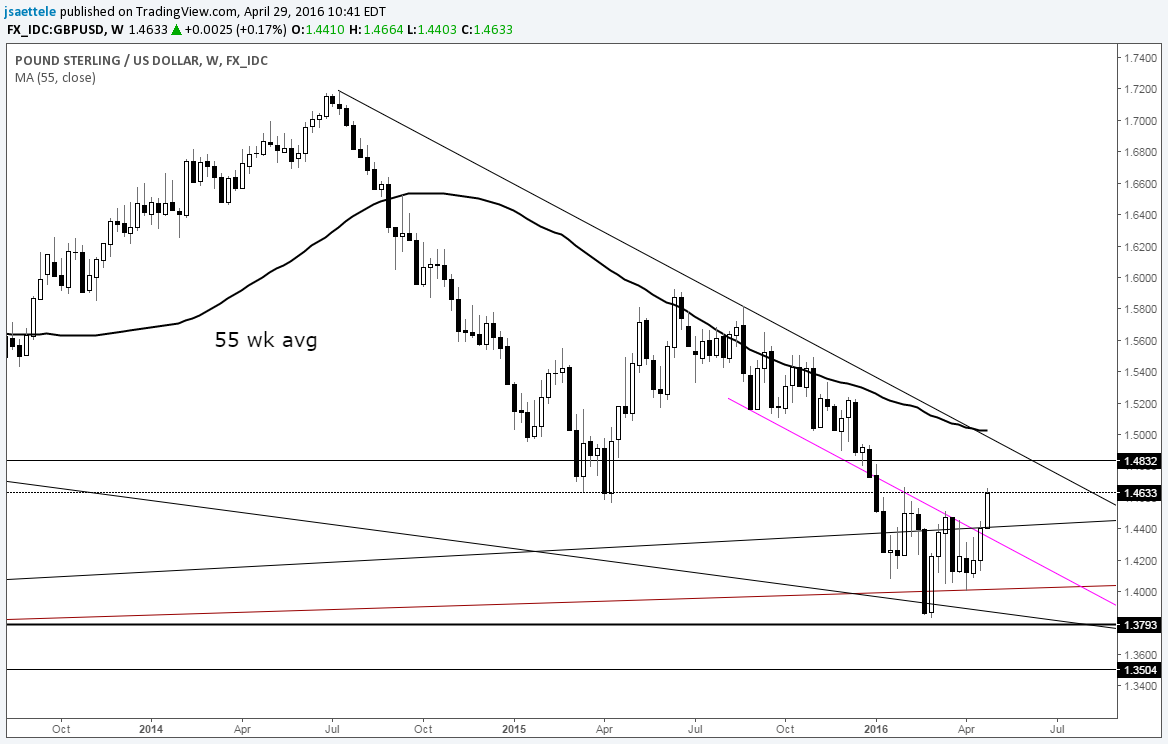
Chart Prepared by Jamie Saettele, CMT
See REAL TIME trader positioning
-There is no change to weekly GBP/USD comments. “Recent price action formed a ‘tweezer bottom’ candlestick formation (FXTW pointed out tweezer bottoms in AUD/USD at the September and January lows). This is a reversal pattern. The fact that the pattern formed amid the chaos of headlines (sentiment extreme on ‘BREXIT’) and at a confluence of trendlines indicates increased risk for a decent sized bounce. General focus is higher, probably until the low 1.50s, although continued failure at an internal trendline is a concern. A crash could then take place into early 2017, based on a 96 month (8 year) cycle low count.”
AUD/USD
Weekly

Chart Prepared by Jamie Saettele, CMT
See REAL TIME trader positioning
-There is no change to AUD/USD analysis. “AUD/USD is nearing the October 2013-January 2014 line near .7800. Also, risk of a top is heightened given COT considerations. It remains to be seen whether or not the cycle week that I first presented over a month ago has any influence. Inversion is a possibility. If resistance at .7800 breaks, then the next upside level of interest is probably .7938.” AUD/USD has responded to resistance. The combination of resistance, COT (overheated), and the longer term cycle analysis (1 week off) indicates renewed downside potential.
Weekly

Chart Prepared by Jamie Saettele, CMT
See REAL TIME trader positioning
-NZD/USD has ‘faked out’ FXTW for about the last 2 months. In any case, NZD/USD is pressing against an important technical level marked by former support (former downtrend support) and ‘new’ uptrend resistance (channel). If NZD/USD is going lower, it needs to do so now.
Weekly

Chart Prepared by Jamie Saettele, CMT
See REAL TIME trader positioning
-There are a host of technical considerations for USD/JPY support between roughly 105 and 106, including the 2002-2007 line, January 2014 high, October 2014 low, and 200 week average. After the turn higher last week, I turned constructive for a run into ‘the mid-116.00s’. I was (really) wrong as USD/JPY has plunged. Watch the 200 week average closely. USD/JPY rebounded from this average following the tops in 1998, 2002, and 2007. The decline from the 1990 top did not stop at this level however.
Weekly
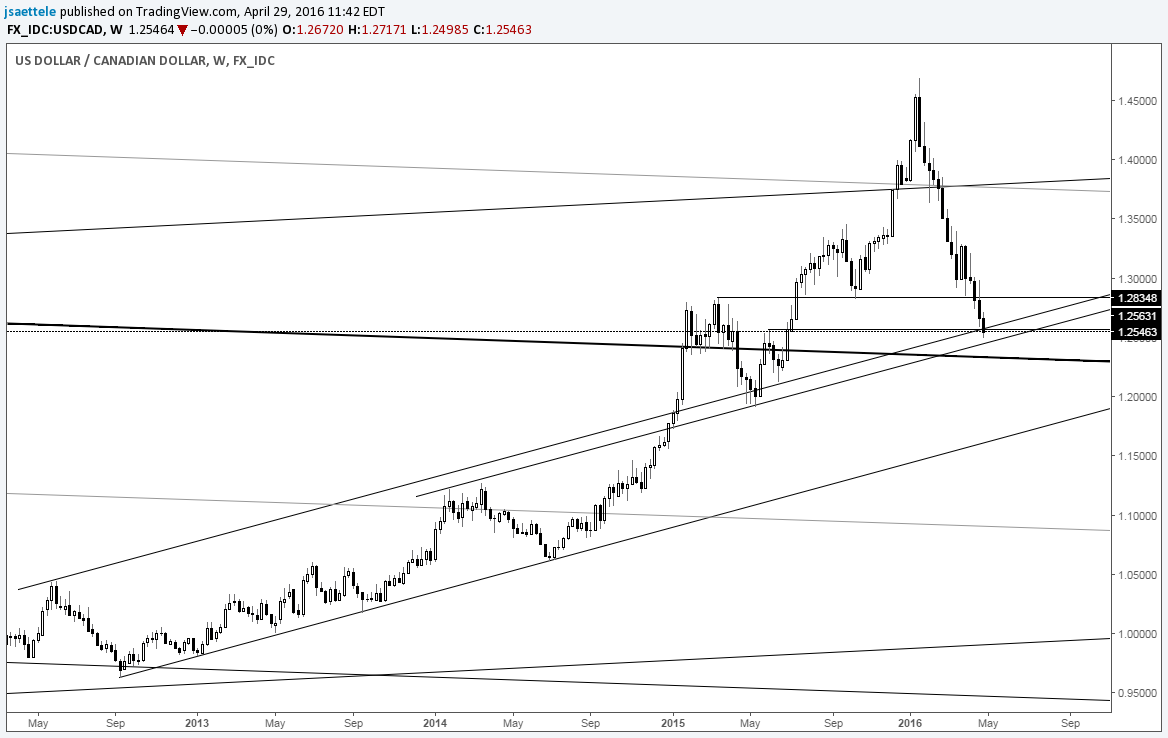
Chart Prepared by Jamie Saettele, CMT
See REAL TIME trader positioning
-FXTW views 1.2830 as a pivot. 1.2830 is both the March 2015 high and October 2015 low. Strength through 1.2830 would signal that at least a near term low is in or a near term bottoming pattern is forming. Until then, just know that USD/CAD is trading in the vicinity of support from the first half of 2015 (1.2350-1.2450).
Weekly

Chart Prepared by Jamie Saettele, CMT
See REAL TIME trader positioning
-There is no change to the latest USD/CHF comments. “USD/CHF made a bullish outside week at the top side of former trendline resistance lines (long and short term). Given long term considerations, the low (.9498) could be significant. Some extremely long term technical considerations are worthy of note when looking at USD/CHF. Read about them here.”


