MKT CALL: MACRO OVERVIEW:
- Concerns around the omicron variant and increased odds of accelerated Fed tapering are starting to get shrugged off.
- US equity markets have almost taken back all of their losses in the past two weeks, with the US S&P 500 on the verge of all-time highs once again.
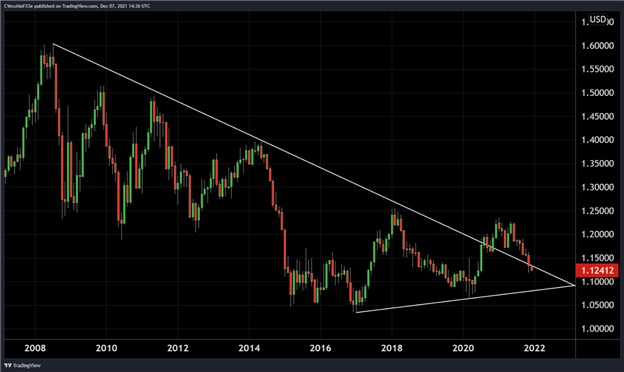
- The differential between US and Eurozone inflation – and thus Fed and ECB policy – suggests more downside may be ahead for EUR/USD rates.
Year-End Rally Beginning?
In this week’s edition of MKT Call: Macro (formerly The Macro Setup), we discussed how data surrounding the COVID-19 omicron variant is proving less concerning for global financial markets than the initial reaction at the end of November. After all, as viruses become more transmissible they tend to be less lethal, which means omicron’s health impact may be limited in scope. Rather, the reaction by governments – lockdowns – could prove more hostile to the global economy.
Elsewhere, market participants continue to digest the evolution in both the Federal Reserve’s and the US Treasury’s lexicon regarding the term ‘transitory.’ But after an initial volatile reaction to Fed Chair Jerome Powell’s comments last Tuesday, it appears sober minds have prevailed; the change in tone is really nothing new if you’ve been parsing Fed policymakers’ comments over the past several months.
Against the backdrop of a US economy that is raging – the Atlanta Fed GDPNow growth tracker for 4Q’21 is a searing hot +8.6% in real annualized terms – the prospect of the Fed announcing an accelerated rate of tapering next week isn’t coming as a surprise. Hot inflation metrics aside, rates markets have been rather ‘steady-as-she-goes,’ having discounted the possibility of 150-bps of rate hikes through the end of 2023 for several weeks now.
*For commentary from Dan Nathan, Guy Adami, and myself on the US Dollar (via the DXY Index), the US S&P 500, gold prices, Bitcoin, among others, please watch the video embedded at the top of this article.
CHARTS OF THE WEEK
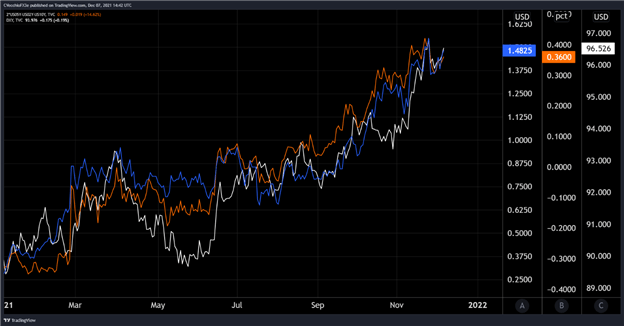
Eurodollar Futures Contract Spread (DECEMBER 2021-DECEMBER 2023) [ORANGE], US 2s5s10s Butterfly [BLUE], DXY Index [WHITE]: Daily Chart (JANUARY 2021 to DECEMBER 2021) (Chart 1)

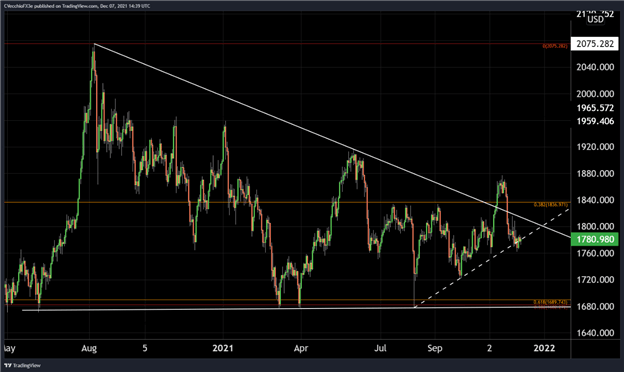
GOLD PRICE TECHNICAL ANALYSIS: DAILY CHART (MAY2020 TO DECEMBER 2021) (CHART 2)

EUR/USD RATE TECHNICAL ANALYSIS: MONTHLY CHART (NOVEMBER 2007 TO DECMEBER 2021) (CHART 3)


--- Written by Christopher Vecchio, CFA, Senior Strategist


