


MKT CALL: MACRO OVERVIEW:
- The omicron variant, is rattling market participants – even as risk assets are in their most favorable time of the year, according to seasonality studies.
- Fed Chair Powell dismissed the term ‘transitory’ from the Fed’s lexicon, suggesting that a faster pace of tapering could arrive sooner than later to combat inflation pressures.
- The net-result of omicron variant concerns coupled with the prospect of a more hawkish Fed has sent jitters through global financial markets.
Volatility Lingering in Markets
In this week’s edition of MKT Call: Macro (formerly The Macro Setup), we talked about news surrounding the latest COVID-19 mutation, the omicron variant, is rattling market participants – even as risk assets are in their most favorable time of the year, according to seasonality studies. Moreover, traders are betting that the Federal Reserve will be less hawkish because of the omicron variant, setting back the US Dollar.
But comments from Fed Chair Jerome Powell on Tuesday appeared to disabuse market participants of the notion that a more hawkish Fed hasn’t arrived. Speaking in front of Congress, Fed Chair Powell dismissed the term ‘transitory’ from the Fed’s lexicon, suggesting that a faster pace of tapering could arrive sooner than later to combat inflation pressures that have “spread” more widely than otherwise anticipated.
The net-result of omicron variant concerns coupled with the prospect of a more hawkish Fed has sent jitters through global financial markets, sparking more volatility as November comes to a close. Accordingly, significant price swings in the US Dollar (via the DXY Index), gold prices, oil prices, and US stock markets may be a feature, not a bug, of the near-term trading environment.
*For commentary from Dan Nathan, Guy Adami, and myself on the US Dollar (via the DXY Index), the US S&P 500, gold prices, Bitcoin, among others, please watch the video embedded at the top of this article.
CHARTS OF THE WEEK
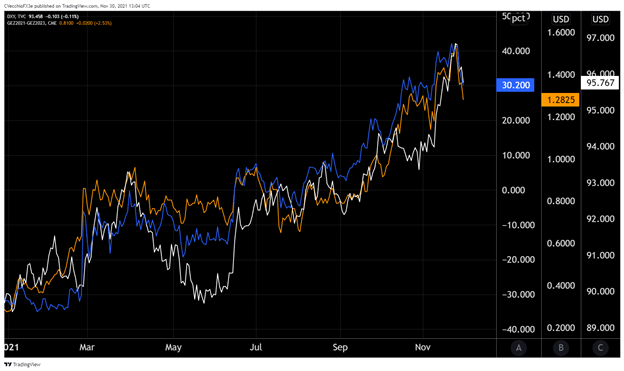
Eurodollar Futures Contract Spread (DECEMBER 2021-DECEMBER 2023) [ORANGE], US 2s5s10s Butterfly [BLUE], DXY Index [WHITE]: Daily Chart (JANUARY 2021 to NOVEMBER 2021) (Chart 1)
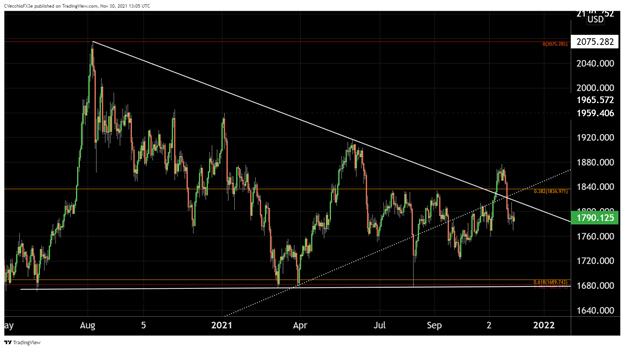
GOLD PRICE TECHNICAL ANALYSIS: DAILY CHART (MAY2020 TO NOVEMBER 2021) (CHART 2)
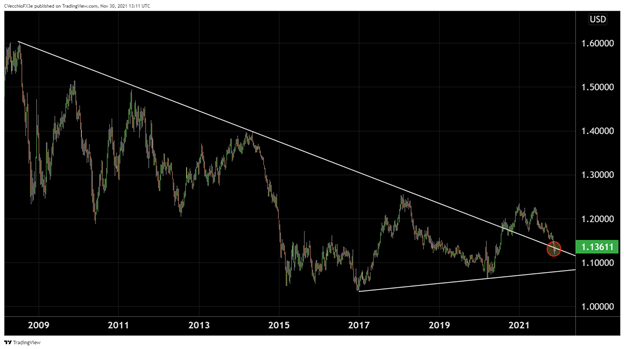
EUR/USD RATE TECHNICAL ANALYSIS: MONTHLY CHART (NOVEMBER 2007 TO NOVEMBER 2021) (CHART 3)

--- Written by Christopher Vecchio, CFA, Senior Strategist


