


The Macro Setup Overview:
- China, global growth - 1:25
- US stocks - 3:20, 4:55, 6:28, 23:10
- US yields, FX rates - 17:20, 22:25
- Gold, Bitcoin - 24:28, 26:00
Feeling Hot, Hot, Hot
This week’s The Macro Setup, featuring Dan Nathan and Guy Adami, focused on the latest US CPI report and how it may impact markets. The hottest US inflation reading since September 1991 has traders wondering, "is the Federal Reserve behind the curve?"
But the devil is in the details - and those details may give the Fed enough cover to keep ignoring elevated price pressures which it calls "largely transitory." Gains by automobile prices (new and used cars) accounted for roughly 1/3 of the upside in the June US inflation report, a sign that supply chain issues (see: semiconductors) are still wreaking havoc on markets.
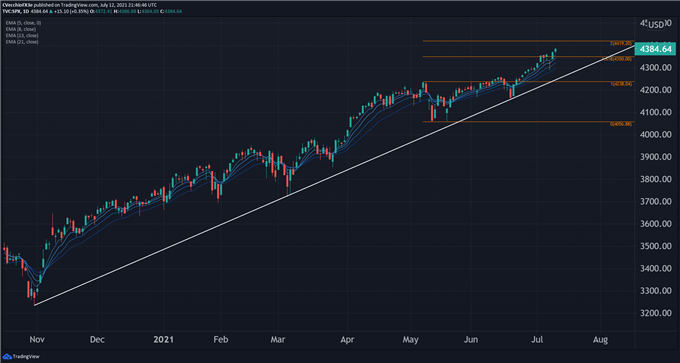
As the Fed continues to look through elevated inflation readings, US equity markets continue to push to fresh record highs. But there has been a significant divergence between 'growth' and 'value' companies in the US S&P 500, and breadth (as measured by comparing the market cap-weighted S&P 500 versus the equal-weighted S&P 500) is starting to fall back.
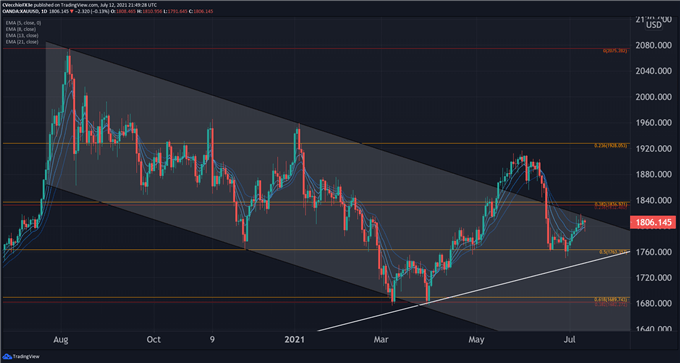
Elsewhere, gold prices still appear to be in the 'technical woods,' and in consideration of the fact that trading is a function of both price and time, the clock is ticking for gold prices. A few more weeks of sideways consolidation and we'll find ourselves back at the rising trendline from the May 2019, March 2020, and March 2021 lows - effectively the uptrend that has defined price action throughout the pandemic.
Finally, it's difficult to find the near-term technical outlook for Bitcoin prices as anything other than dour. Price action is "looking heavy," as Dan Nathan noted, and a loss of the January and June swing lows around 29000 could prove to be a sign of a major near-term top.
*For commentary from Dan Nathan, Guy Adami, and myself on the US Dollar (via the DXY Index), the US S&P 500, gold prices, among others, please watch the video embedded at the top of this article.
Charts of the Week
Gold Price Technical Analysis: Daily Chart (July 2020 to July 2021) (Chart 1)
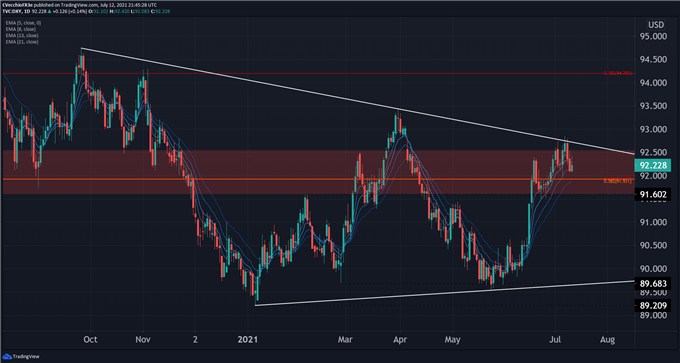
DXY Index Price Technical Analysis: Daily Chart (July 2020 to July 2021) (Chart 2)
US S&P 500 Technical Analysis: Daily Chart (October 2020 to June 2021) (Chart 3)

--- Written by Christopher Vecchio, CFA, Senior Currency Strategist


