


Price & Time covers key technical themes daily and can be delivered to your inbox each morning by joining the distribution list: Price & Time
Talking Points
- NZD/USD remains under pressure following brief foray over 200-day MA
- November low is critical from a timing perspective
Looking for real-time forex market sentiment? Get it HERE
NZD/USD: Starting Down or Bullish Backtest?
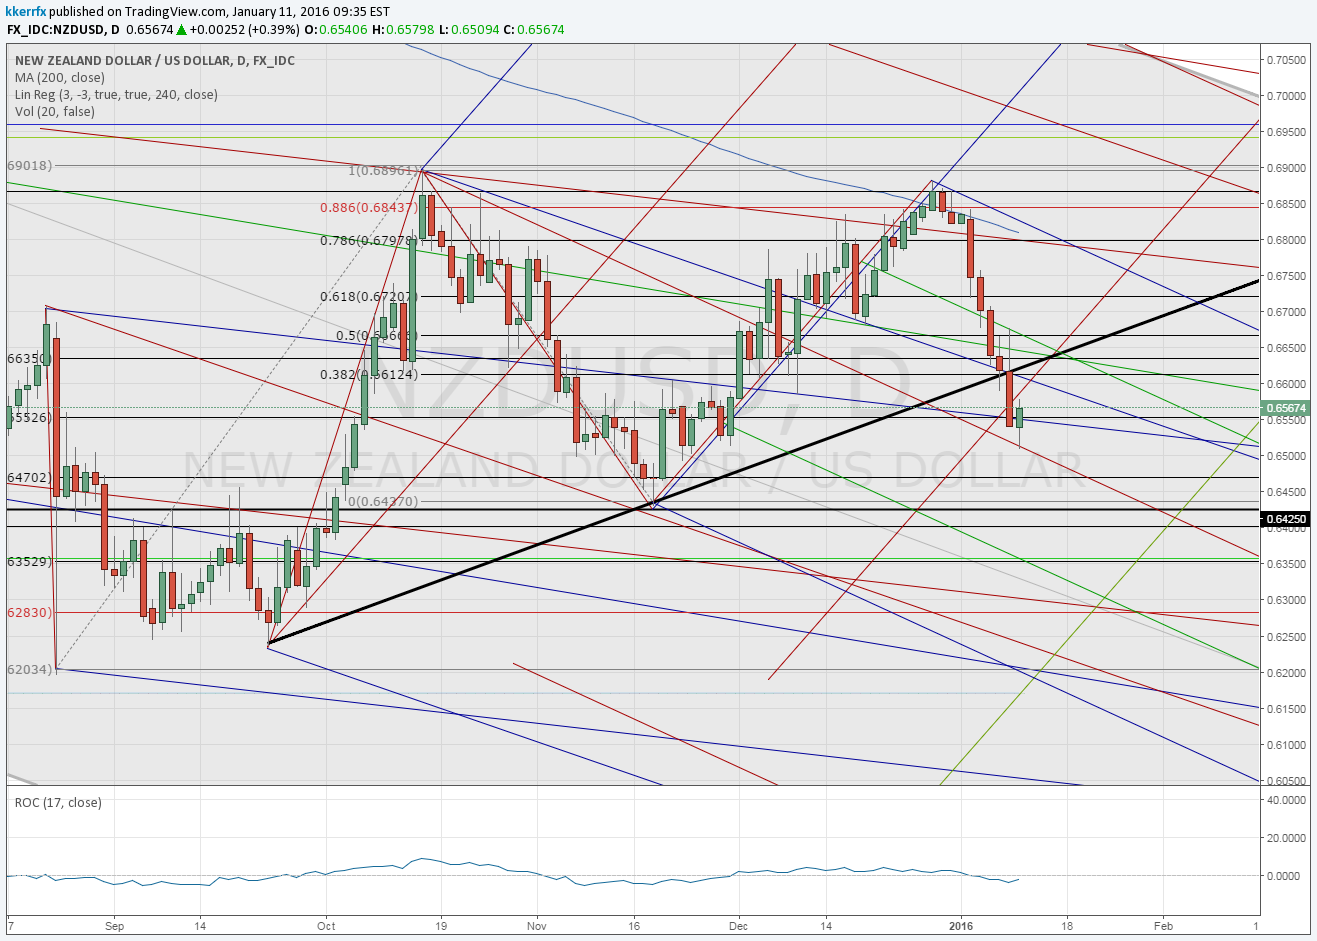
The timing surrounding the mid-November low in NZD/USD was pretty significant as it marked a nice confluence of several key cyclical relationships. The highlights include a 1,570 calendar day Armstrong Pi cycle from the 2011 post float all-time high, the 38% retracement in time of last year’s January to August decline as well as the 38% retracement of the time elapsed between the 2Q high close and the 2015 low close. The rally that followed was fairly significant as the exchange rate recovered more than 7% from low to high before selling off aggressively these past couple of weeks. The big question now: Was the 7% rally off the .6430 low all we are going to get from that timing confluence?
Admittedly, one of the biggest drawbacks in analysis of the x-axis of time is determining duration. While the techniques I use will point to periods for potential change in trend, they rarely give any real insights into the length of the move that could follow. Other than the proximity of other timing relationships, simple price action is the main thing to watch in the aftermath of a turn. In the Kiwi, a few things stand out for me on the daily chart following that November turn. The rate failed to get above the .6897 mid-October high. I would feel a lot better about the possibility of another leg higher if it had been surpassed before pulling back. I also do not like the fact that Kiwi only settled one day above the 200-day moving average before heading sharply lower and breaking below the upward sloping trendline connecting the September and November lows. All things considered, the evidence seems to point to a potential broader trend resumption.
The key downside pivot going forward is obviously .6430. A break below there would further confirm the negative price action of the past few weeks and more importantly invalidate the broader bullish potential of the November turn window. A successful hold of .6430 followed by move back through .6640 would relieve some of the more immediate downside technical pressure on the Bird, but it really needs to get above .6897 to open the gates to a more significant move higher. From a timing perspective, it is worth tinting that today marks a minor confluence of Fibonacci relationships, but the more important period looks to be around month-end.
--- Written by Kristian Kerr, Senior Currency Strategist for DailyFX.com
To contact Kristian, e-mail instructor@dailyfx.com. Follow me on Twitter @KKerrFX


