


Price & Time covers key technical themes daily and can be delivered to your inbox each morning by joining the distribution list: Price & Time
Talking Points
- Several harmonic timing relationships this week
- 2040 area important Gann resistance
Want to develop a more in-depth knowledge on the market and strategies? Take a look at DailyFX Trading Guides
forex technical analysis,forex analysis,forex trading strategies,forex signals,forex strategies,forex strategy, forex trading
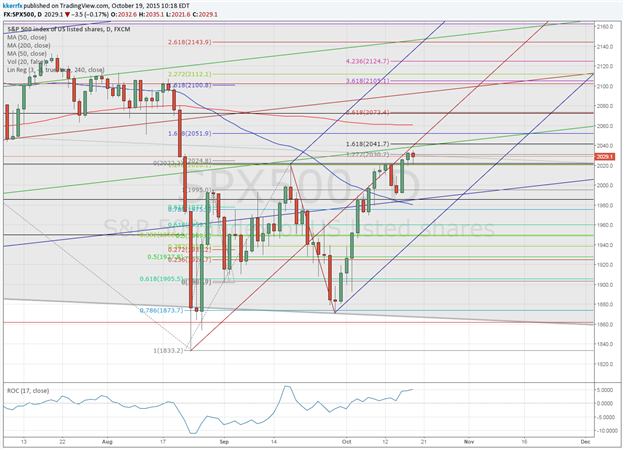
Today is the 28th anniversary of the 1987 stock market crash. Gann wrote about anniversary dates and their importance in a few of his works and the fact is some strange things have happened on this date over the years to the market since the crash so it is probably worth being aware of. I should point out that this week looks important to the S&P 500 from a timing standpoint for reasons other than just simple anniversaries as it marks the 61.8% retracement in time of the May high to the August low. The low late last month in the SPX occurred right at the 38% retracement in time of that same move so it looks to be an influential harmonic sequence. This week is also the 61.8% extension in time of the August and September lows and a measured move in time of the August – September rebound so there is more than enough potential timing symmetry this week to warrant some caution.
With the S&P 500 showing some signs of being overbought here there looks to be some risk of a turnaround into this key timing period. In cash, the 61.8% retracement of the May – August decline comes in around 2033. Just above there is the 4th square root relationship of the year’s low at 2040 and the 2nd square root relationship of the year’s high at 2042 so this looks be a clear potential point of failure. Traction above there would point to a more important final push higher towards the 200-day moving average and more aggressive Fibonacci objectives near 2075 before an attempt at a turn. Weakness under 1985 is needed to confirm that some sort of high is in place.
--- Written by Kristian Kerr, Senior Currency Strategist for DailyFX.com
To contact Kristian, e-mail instructor@dailyfx.com. Follow me on Twitter @KKerrFX


