


Talking Points
- USD/JPY at a crossroads
- Reaction around 121.00 should prove important
Unfamiliar with Gann Square Root Relationships? Learn more about them HERE.
There are a couple of ways to looks at the price action in USD/JPY over the past few weeks. The first is just as a modest correction to the primary trend. Supporting this view is the fact that the exchange rate did make a new multi-year high last month and no real big levels of support have been breached since the corrective process started. In this view USD/JPY is just biding time before the next push higher. The alternative view is that USD/JPY effectively failed in March where it did in December leaving a potential double top on the charts. The other potential negative here is that the action since mid-February can be interpreted as a potential head & shoulders top. A failure somewhere between 120.50 and 121.00 would finish the right shoulder and set the stage for a much deeper correction against the trend. A foothold over 121.00 would suggest the USD uptrend is resuming.
To receive other reports from this author via e-mail, sign up to Kristian’s e-mail distribution list via this link.
USD/JPY Daily Chart: April 10, 2015
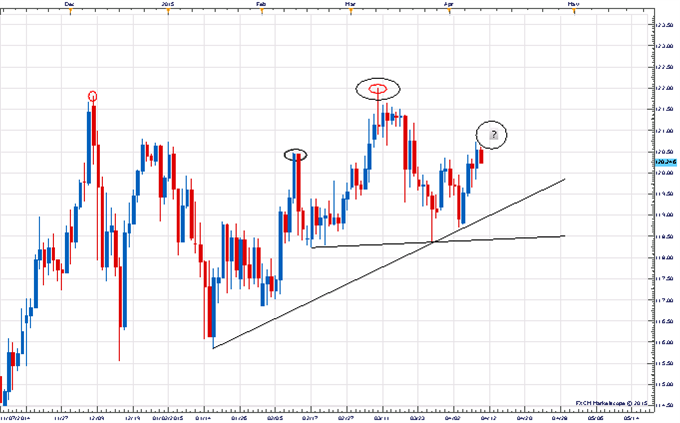
Charts Created using Marketscope – Prepared by Kristian Kerr
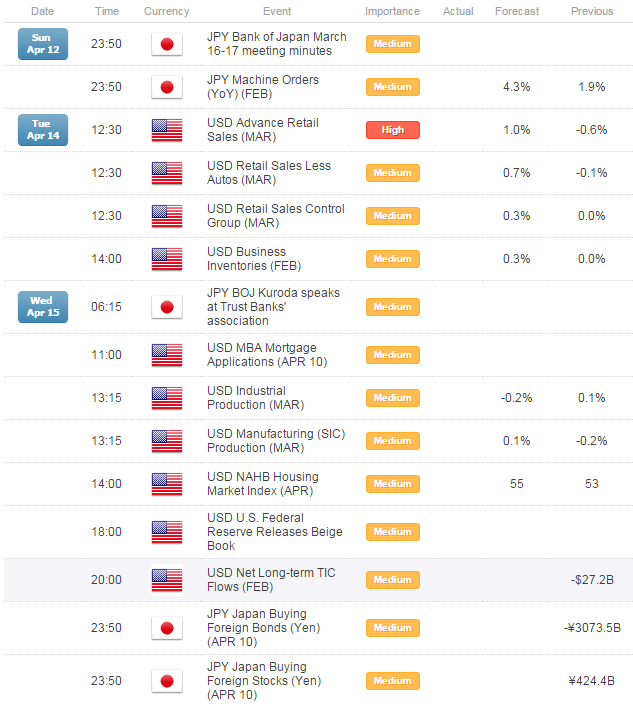
Key Event Risk in the Week Ahead:
LEVELS TO WATCH
Resistance: 120.60 (Gann), 120.90 (Gann)
Support: 120.20 (Fibonacci), 119.80 (Gann)
Strategy: Sell USD/JPY
Entry: Sell USD/JPY at 120.60
Stop: Daily close above 120.90
Target: Open
--- Written by Kristian Kerr, Senior Currency Strategist for DailyFX.com
To contact Kristian, e-mail instructor@dailyfx.com. Follow me on Twitter at@KKerrFX.


