


Aussie Dollar vs Canadian Dollar Technical Forecast
- Bull’s momentum has eased, but the bias higher
- AUD vs CAD price chart exposes a possible reversal on the horizon
A Multi-Month High
Last week, AUD/CAD hit a near 20-month high at 0.9640. However, the price retreated after as some bulls seemed to cut back. Ultimately, a weekly candlestick closed modestly in the green with a 0.4% gain.
Alongside that, the Relative Strength Index (RSI) abandoned overbought territory (70) and fell to 60 highlighting that bulls were losing momentum.
AUD/CAD DAILY PRICE CHART (NoV 25, 2018 – July 31, 2020) Zoomed Out


AUD/CAD DAILY PRICE CHART (June 4 – July 31, 2020) Zoomed IN
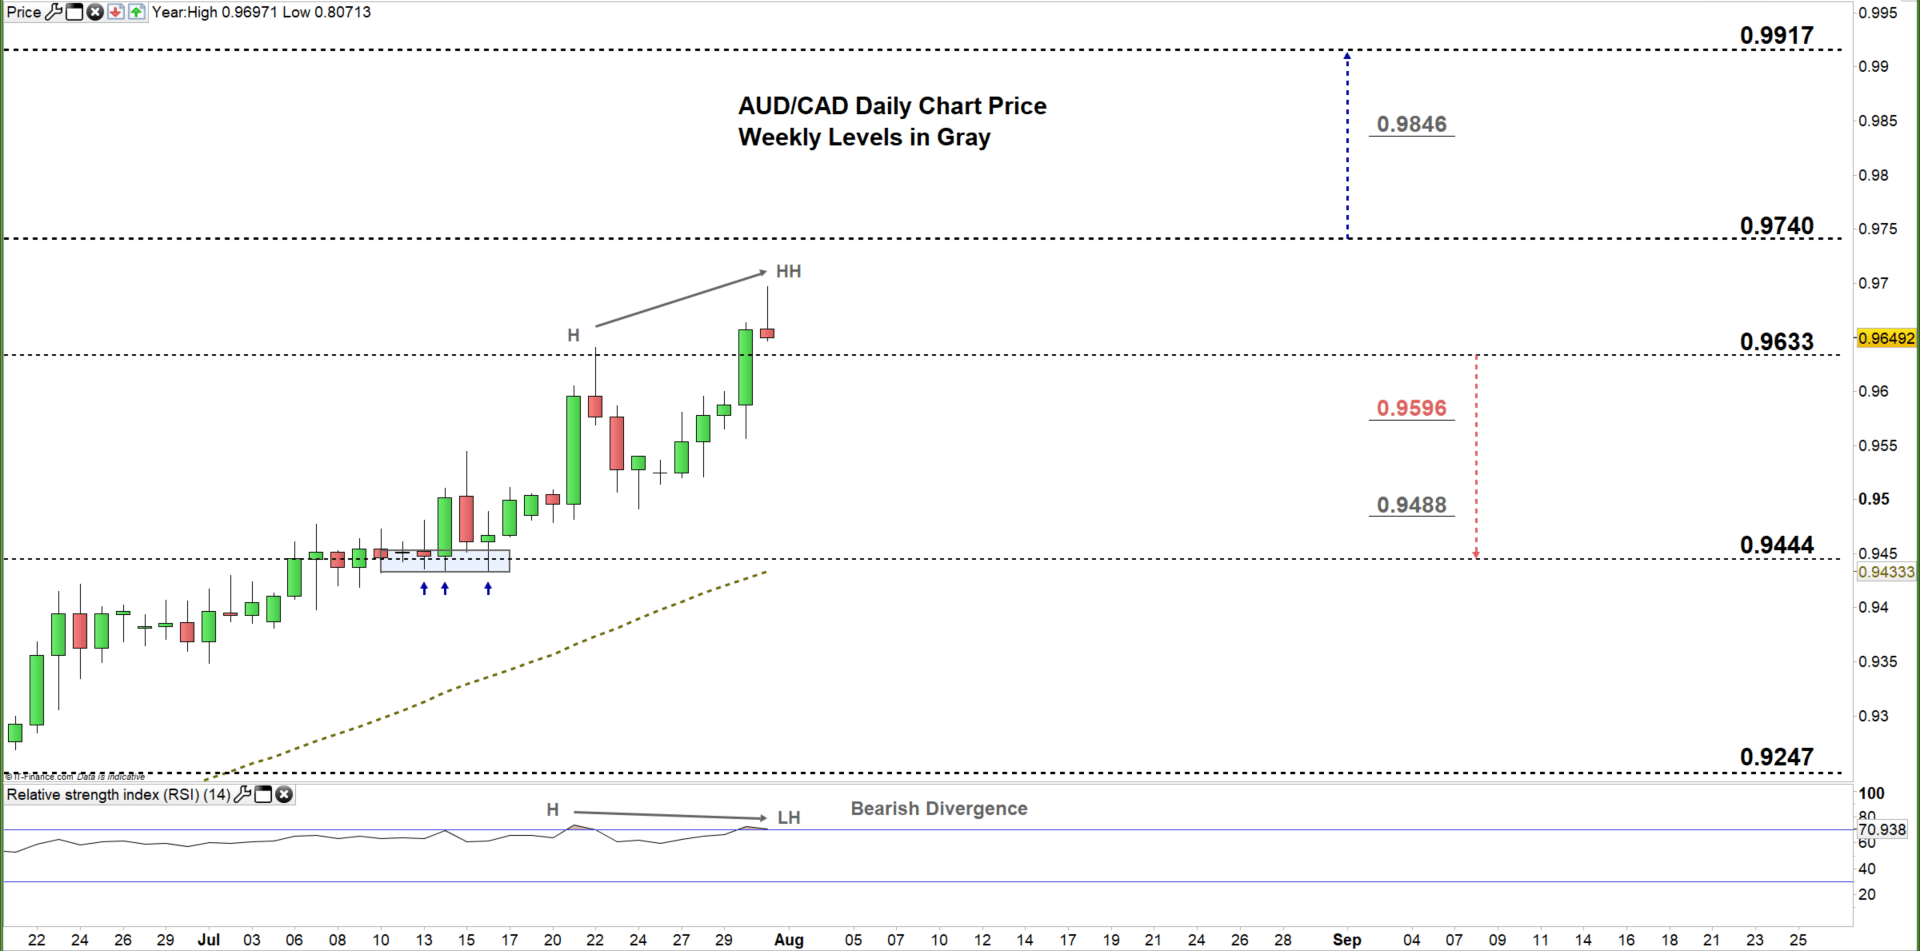
Yesterday, AUD/CAD climbed to the current 0.9633- 0.9740 trading zone indicating that bulls were still in charge.
However, it’s important to note the price and RSI divergence as the former created a higher high, while the latter created a lower high, signalling a possible reversal of the upward trend.
A daily close below the low end of the current trading zone could reverse the price’s direction towards the weekly support level at 0.9444 ( July 2019 high).
On the other hand, a daily close above the high end of the zone could encourage bulls to extend the rally towards the monthly resistance level at 0.9917 (April 2017 low) .

AUD/CAD Four-Hour PRICE CHART (JUNE 22 – JULY 31, 2020)

On July 24, AUD/CAD rebounded from the lower bound support line of the bullish channel originated from the June 21 low at 0.9268 then rallied after and broke above the higher bound resistance line of the same channel reflecting a stronger upward momentum.
To conclude, while the bullish bias is still in place the price/RSI divergence provides a good base of a possible reversal. Additionally, a break below the higher bound support of the aforementioned bullish channel highlights a weaker bullish sentiment.
Therefore, a break below 0.9628 could send AUD/CAD towards 0.9578, while a break above 0.9786 may trigger a rally towards 0.9890. As such, the support and resistance levels underscored on the four-hour chart should be kept in focus.
Written By: Mahmoud Alkudsi
Please feel free to contact me on Twitter: @Malkudsi


