


Aussie Dollar vs Japanese Yen Technical Forecast
- Bulls momentum has eased, but the bias higher
- AUD/JPY price chart highlights a possible reversal on the horizon
A Multi-Month High
Last week, AUD/JPY hit an over 14-month high of 76.87. However, the price retreated after as some bulls seemed to cut back. Ultimately, a weekly candlestick closed modestly in the green with a 0.7% gain.
Alongside that, the Relative Strength Index (RSI) fell from 70 to 57 highlighting that bulls were losing momentum.
AUD/JPY DAILY PRICE CHART (JUn 1, 2018 – July 29, 2020) Zoomed Out

AUD/JPY DAILY PRICE CHART (APRIL 14 – July 29, 2020) Zoomed IN

On July 21, AUD/JPY climbed to the current 75.27 -77.37 trading zone. However, the price declined after and tested the low end of the zone twice highlighting a weaker bullish sentiment.
It’s important to note the price and RSI divergence as the former created a higher high, while the latter created a lower high, signaling a possible reversal of the upward trend.
A daily close below the low end of the current trading zone could send AUDJPY towards the neckline of a Double Top pattern (a reversal pattern) residing at 72.53.
On the other hand, a failure in closing below the low end of the zone may encourage bulls to rally the price towards the monthly resistance at 77.37 (February 2019 low).

AUD/JPY FOUR-HOUR PRICE CHART (JULY 14 – JULY 29, 2020)
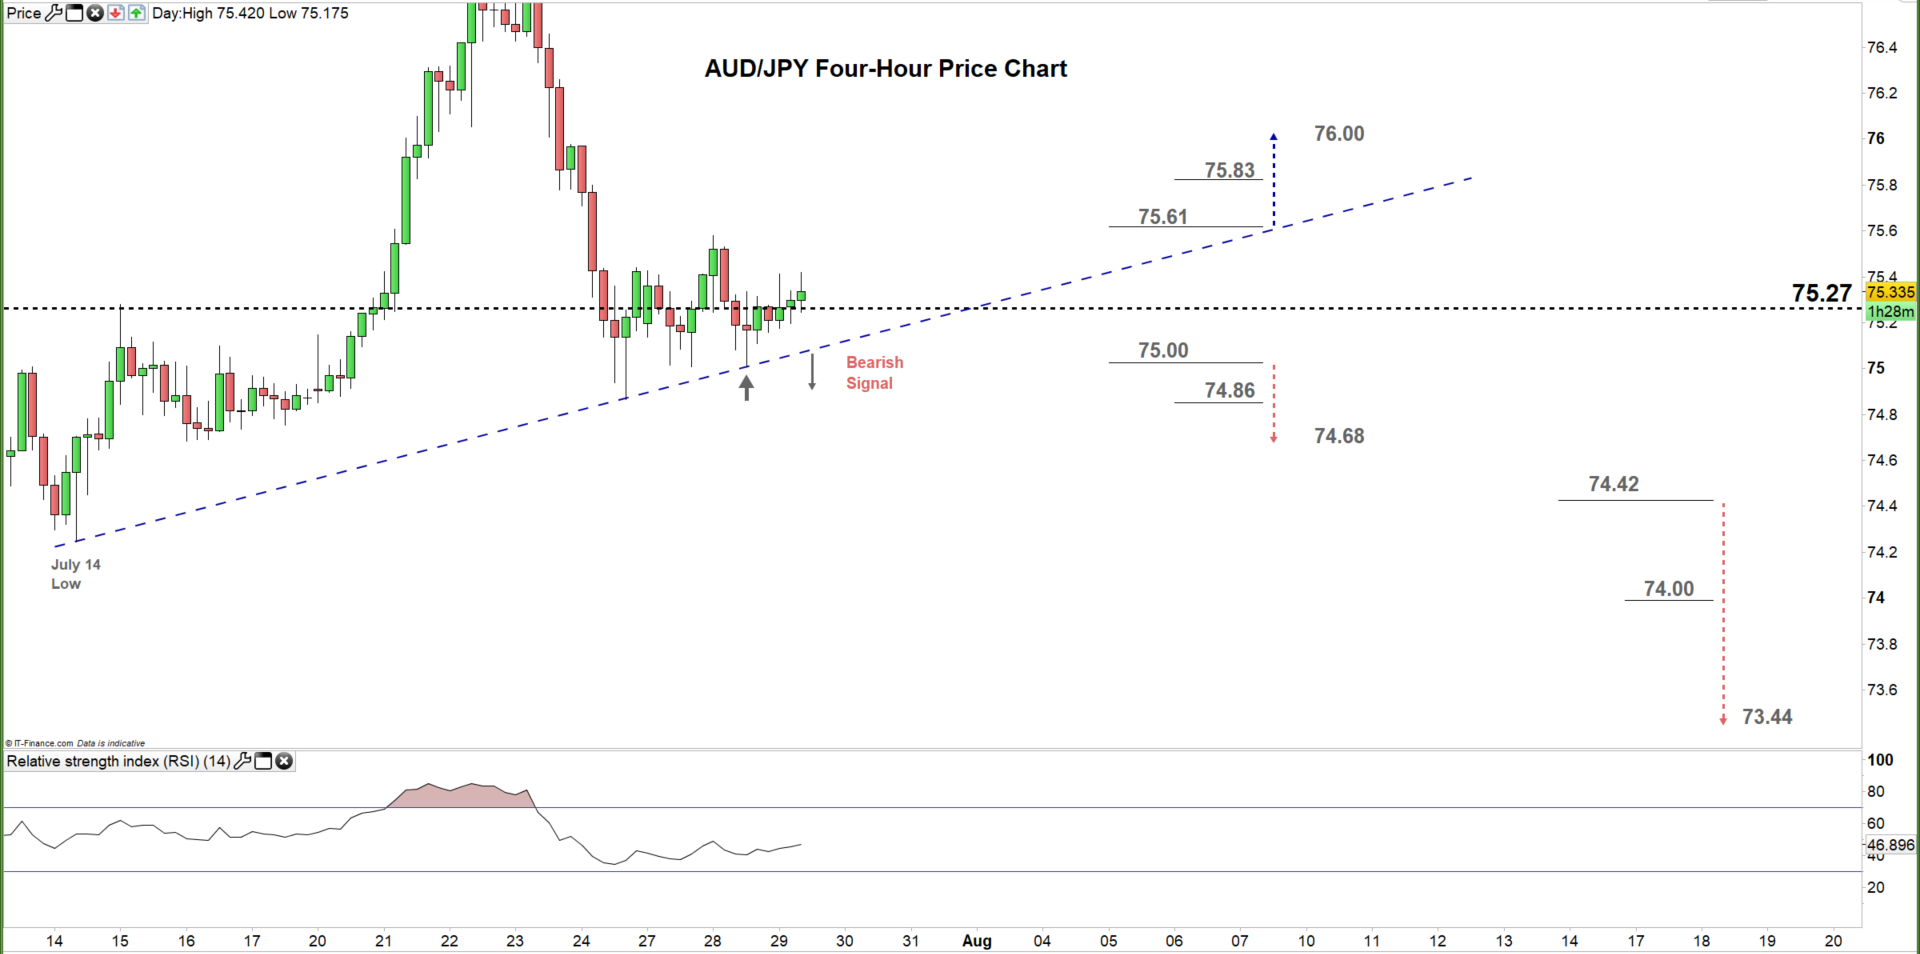
Yesterday, EUR/USD failed to break below the bullish trendline support originated from the July 14 low at 74.24 indicating that bullish momentum remained intact.
To conclude, while the bullish bias is still in place the price/RSI divergence provides a good base of a possible reversal. Therefore, a break below the 75.00 threshold – a psychological trading level – could send AUD/JPY towards 74.68, while, a break above 75.61 may trigger a rally towards 76.00 handle. As such, the support and resistance levels underscored on the four-hour chart should be kept in focus.

Written By: Mahmoud Alkudsi
Please feel free to contact me on Twitter: @Malkudsi


