


British Pound vs Swiss Franc Technical Forecast
- Weaker risk-on sentiment boosts Swiss Franc demand
- Bearish signals on GBP vs CHF price chart
GBP/CHF- Bulls Ease up
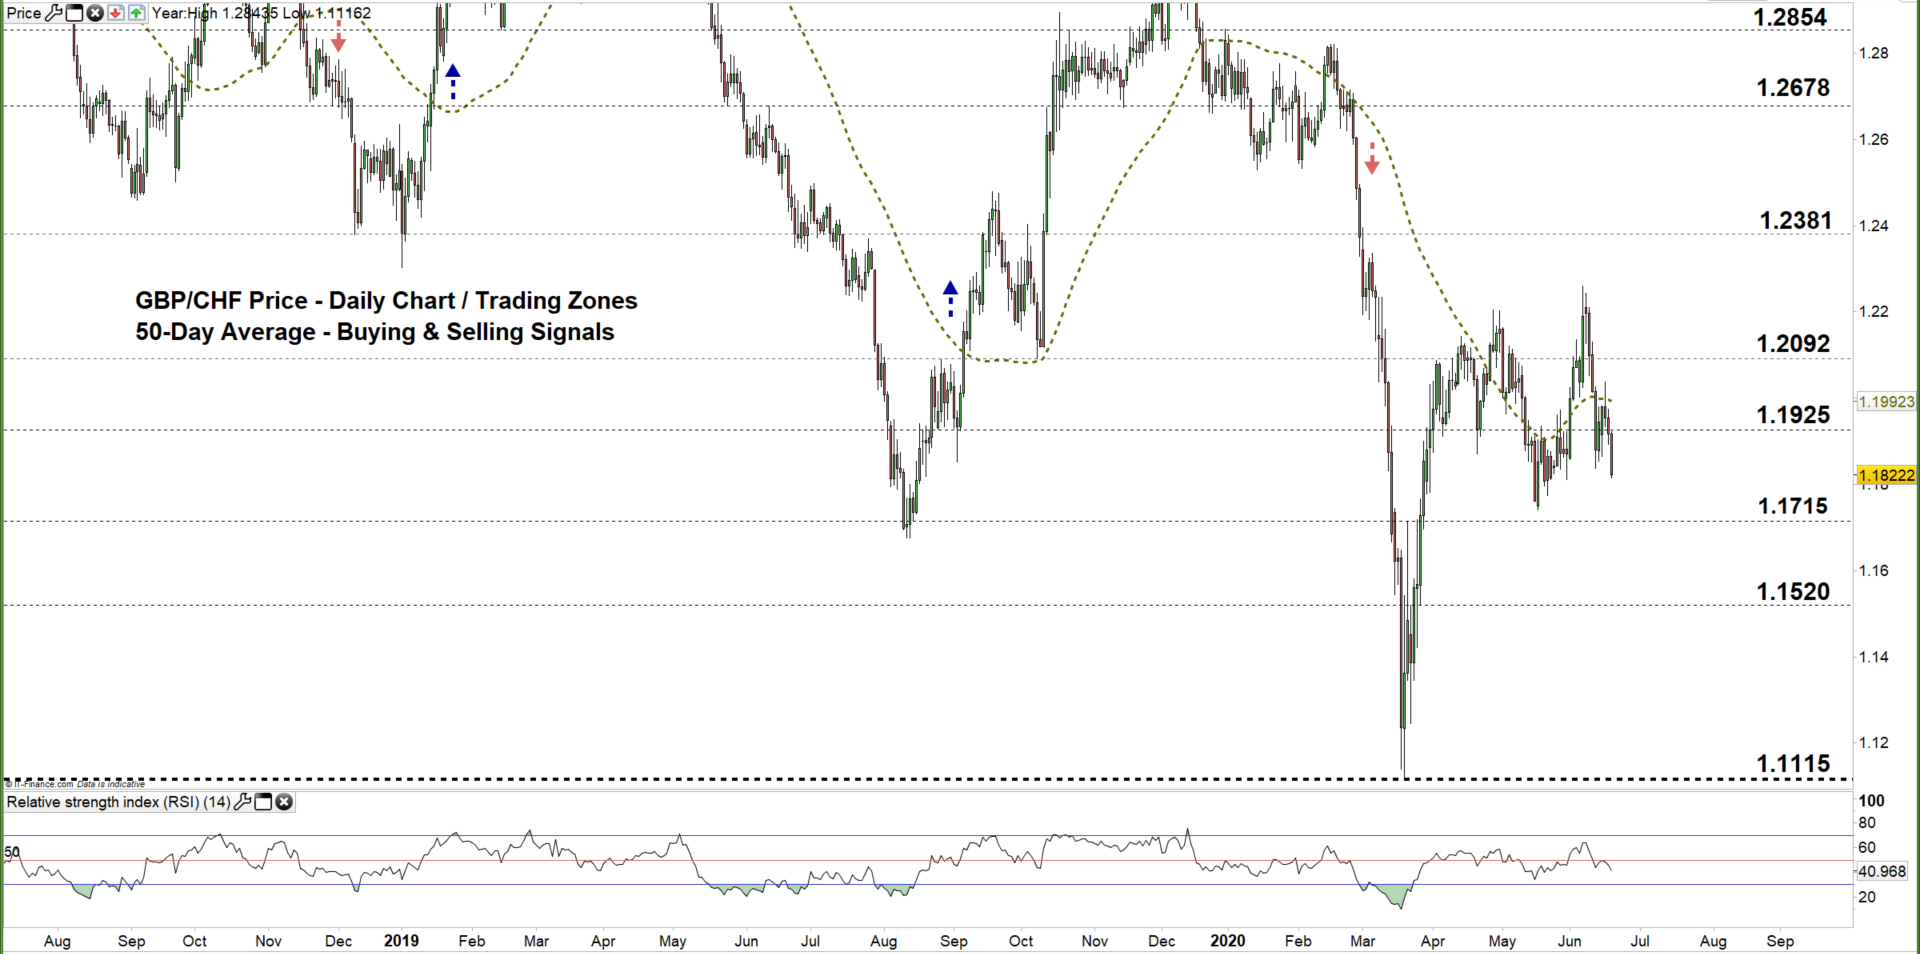
On June 5, GBP/CHF rallied to a three-month high at 1.2259 however, the price declined after as some bulls seemed to cut back. Last week, bulls eased up further and caused the weekly candlestick to close in the red with a 2.0% loss.
The latest updates of a potential second wave of the Coronavirus in China and the resurgence of coronavirus cases in the US weighed on the market’s optimism and increased demand on safe havens causing British pound bulls to exit the market.
GBP/CHF Daily PRice CHART (July 20, 2018 – June 18, 2020) Zoomed Out

GBP/CHF Daily PRice CHART (March 10 – June 18, 2020) Zoomed In
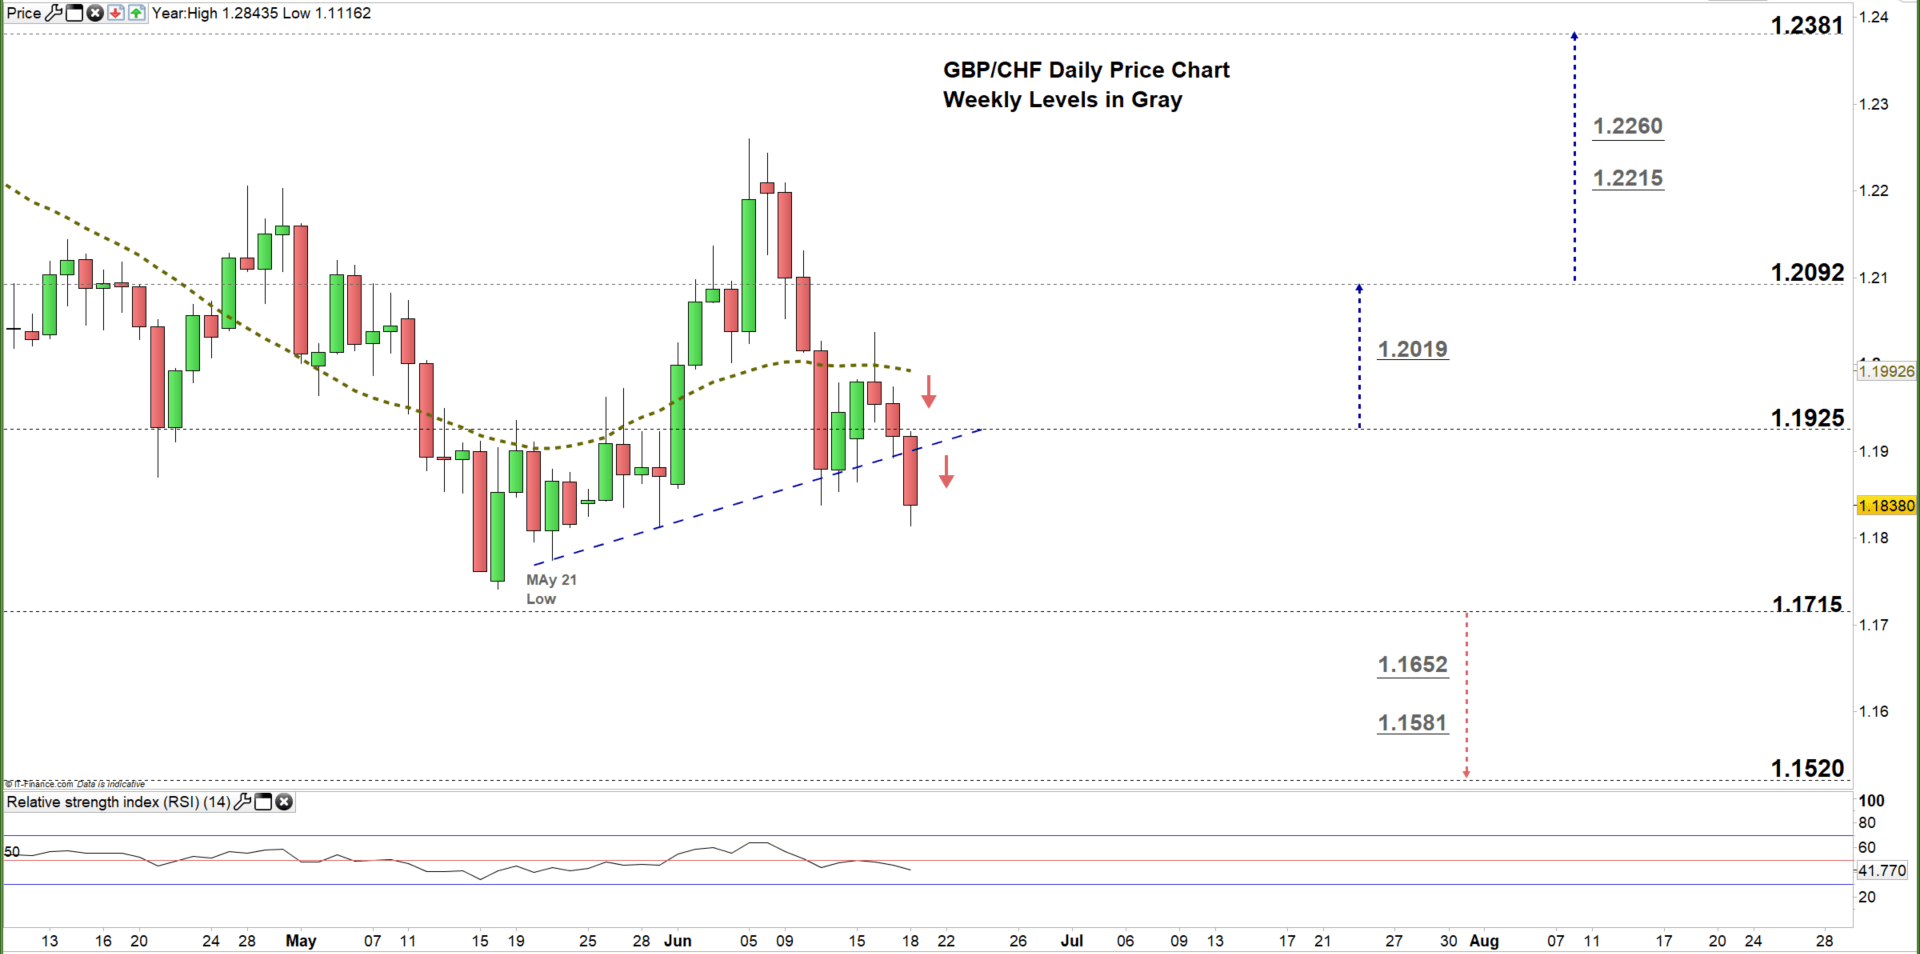
On June 11, GBP/CHF closed below the 50-day moving average and generated a bearish signal. This week, the price failed to close above this indicator and declined to the current trading zone 1.1715 -1.1925 highlighting that bearish momentum remains intact.
Today, the pair has broken below the uptrend line originated from the May 21 low at 1.1774 reflecting a stronger bearish sentiment. Therefore, a close below the low end of the aforementioned zone may encourage bears to press GBPCHF towards 1.1520.
With that said, any close above the high end of the zone reflects bear’s indecision and may cause a rally towards 1.2092. Any further close above that level could extend the rally towards 1.2381.
See the daily chart (zoomed in) to know more about the key levels to monitor in both scenarios.

GBP/CHF Four Hour PRice CHART (April 22 – June 18, 2020)
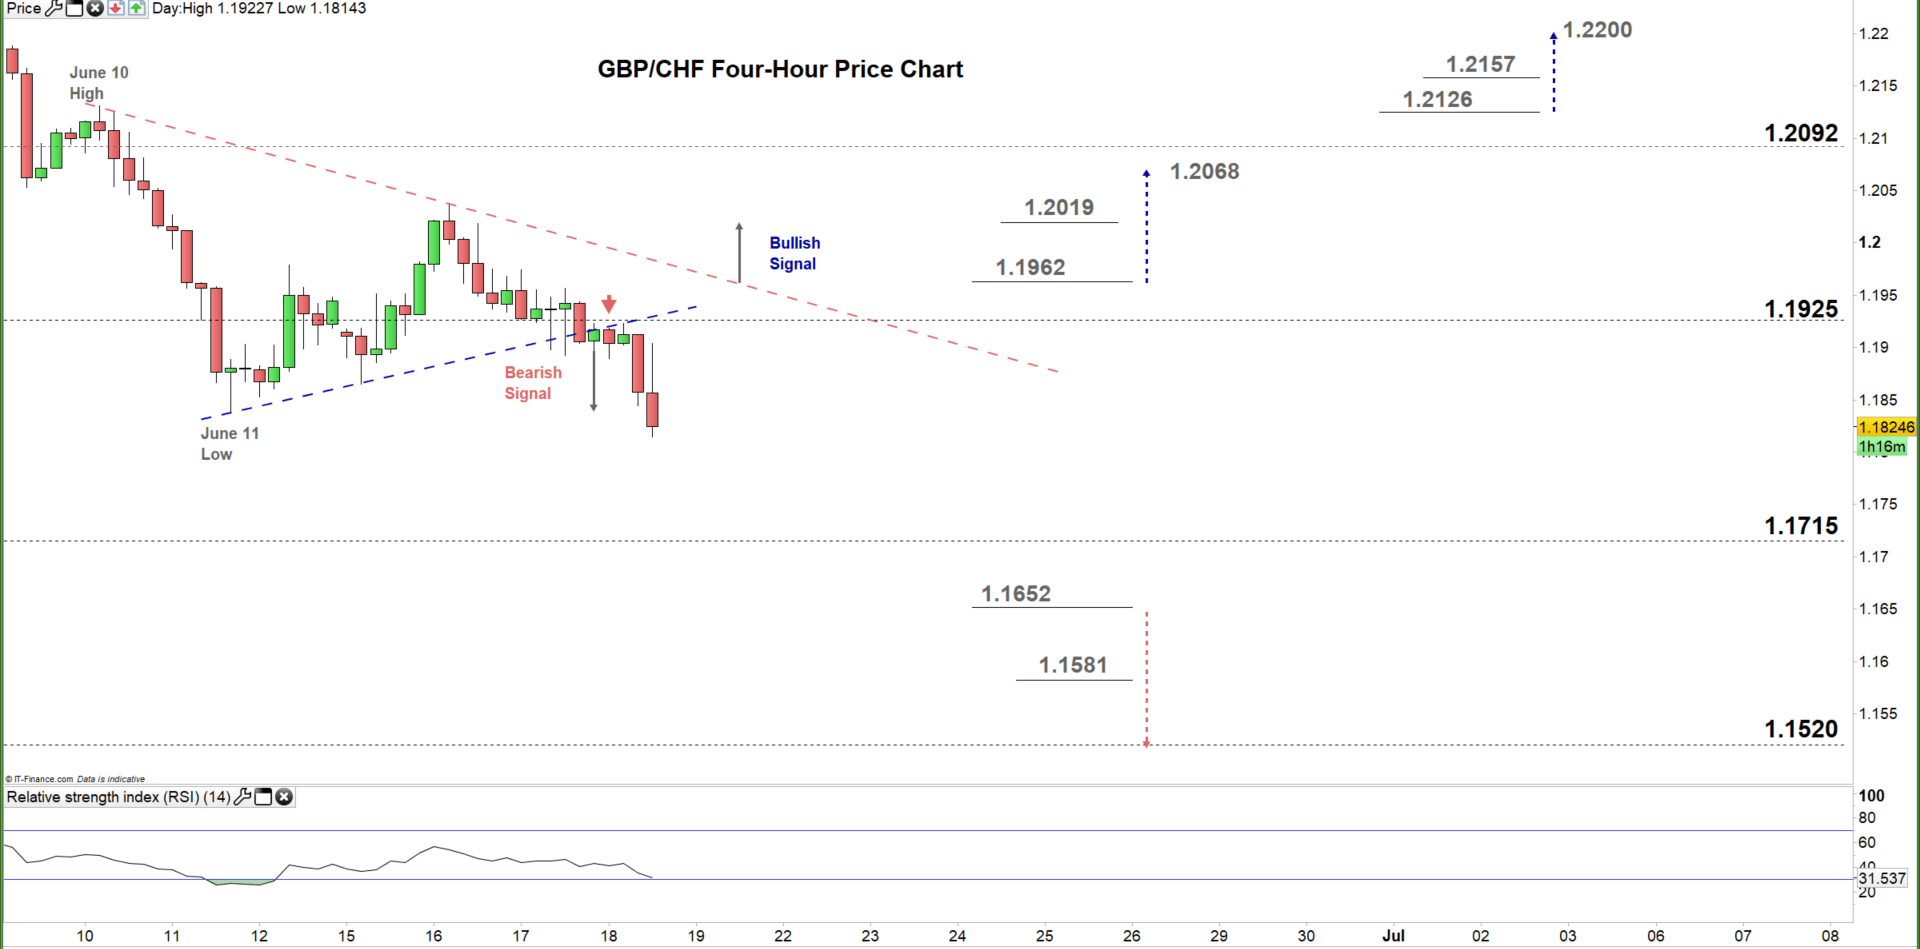
Yesterday, GBP/CHF broke below the uptrend line originated from the June 11 low at 1.1838, and generated a bearish signal. Today, the price has rebounded from the same line indicating that bears were in charge. Nonetheless, any break above the downtrend line originated from the June 10 High at 1.2130 would be considered a bullish signal.
Thus, a break above 1.1962 could trigger a rally towards 1.2068. In turn, a break below 1.1652 may cause send GBPCHF towards 1.1520. Yet, the technical levels underscored on the chart should be kept in focus.

Written By: Mahmoud Alkudsi,Market analyst
Please feel free to contact me on Twitter: @Malkudsi


