


Aussie Dollar vs Japanese Yen Technical Outlook
- Bears ease up yet still in charge
- AUD/JPY faces a key resistance level
Stalled Bearish Momentum
On March 31, the price created a lower high at 65.58 indicating that bearish momentum was still intact. Later on, the price closed the weekly candlestick on Friday in the red with 2.3% loss.
Alongside that, the Relative Strength Index (RSI) remained flat below 50, signalling a paused downtrend move.
AUD/JPY DAILY PRICE CHART (JUn 11, 2018 – April 8, 2020) Zoomed Out


AUD/JPY DAILY PRICE CHART (SEP 1 – April 8, 2020) Zoomed IN
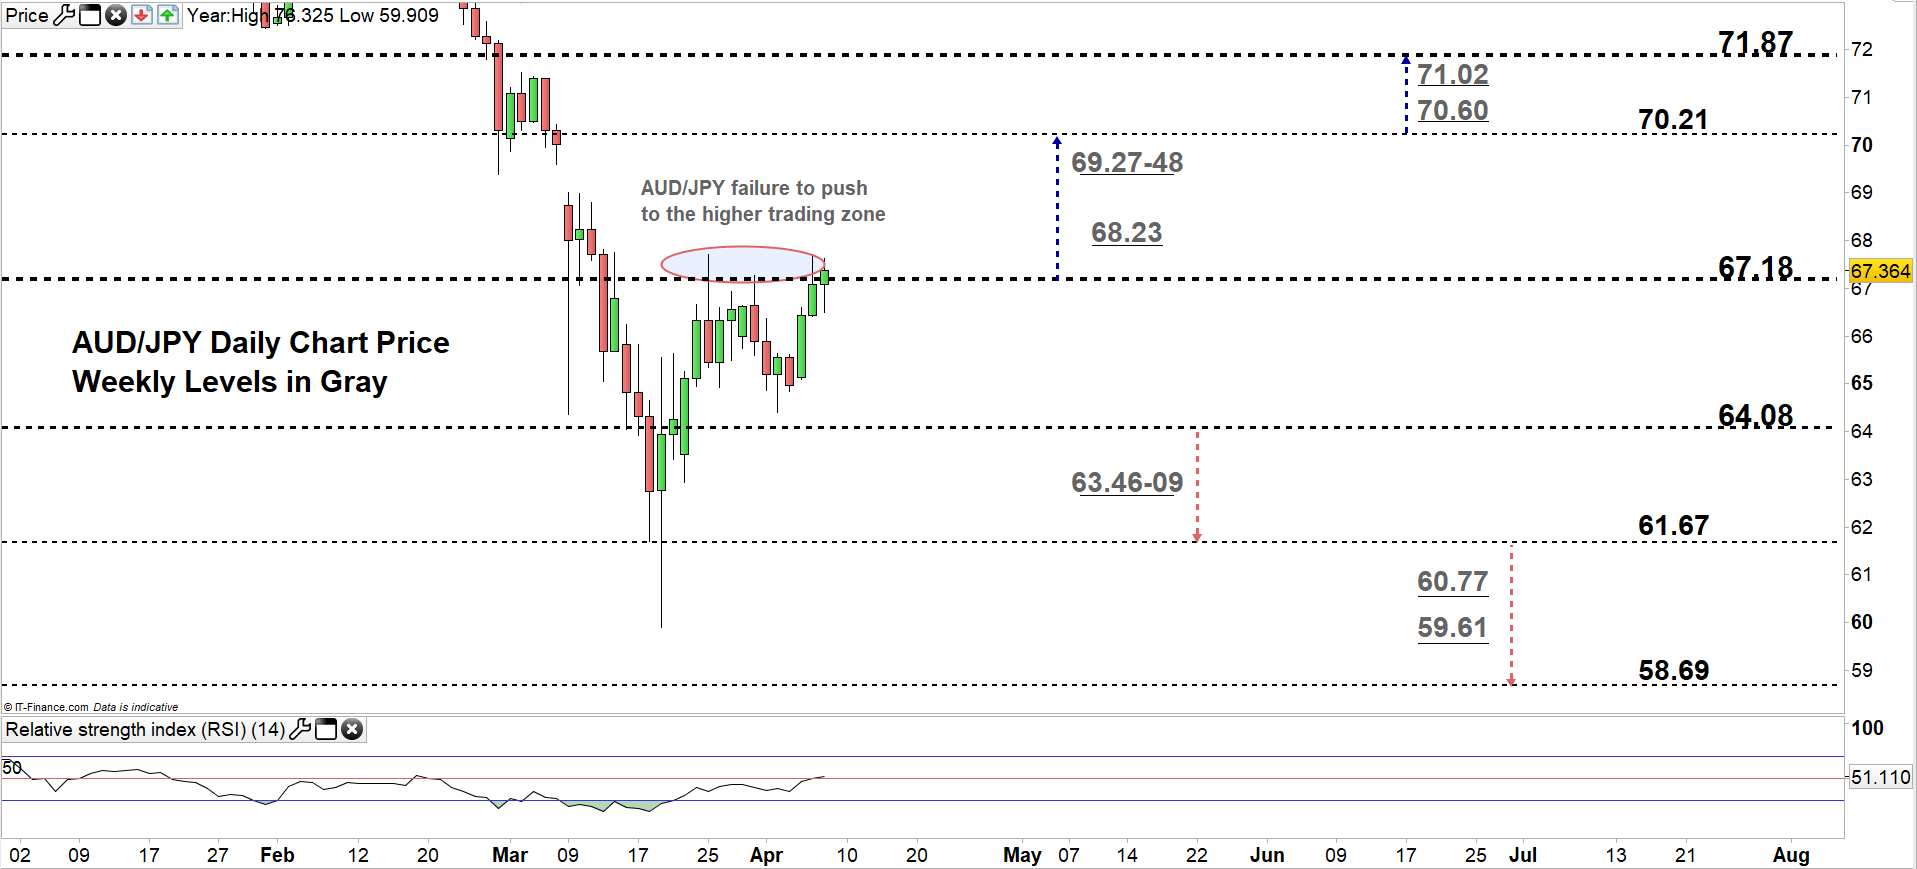
Looking at the daily chart, we noticed that on March 20 AUD/JPY climbed to current traded zone 64.08 – 67.18. Since then, the price has failed in multiple occasions to rally off the zone.
Thus, another failure in closing above the high end could reverse the pair’s direction towards the low end of the zone. Further close below that level may encourage bears to push towards 61.67. In that scenario, the weekly support area underscored on the chart should be considered.
On the flip-side, any successful close above the high end of the zone may cause a rally towards 70.21. Further close above that level could extend the rally towards 71.87. Having said that, the weekly resistance levels and area marked on the chart (zoomed in) should be watched closely.

AUD/JPY Four-Hour PRICE CHART (FEb 11– April 8, 2020)

From the four- hour chart, we noticed that on March 23 AUD/JPY rallied above the downtrend line originated from the March 11 high at 68.79. On Tuesday, the price broke above the downtrend line originated from the March 25 high 67.70 and currently eyes a test of 69.27.
A break above 68.23 would be considered as an additional bullish signal. This increases the likelihood of AUDJPY testing 69.27. Yet, the psychological resistance level underlined on the chart should be kept in focus. In turn, any break in the other direction i.e. below 65.57 could send the price towards 64.38 . Although, the daily support level printed on the chart should be monitored.
See the chart to find out more about key levels Cable would encounter in a further bearish /bullish scenario.

Written By: Mahmoud Alkudsi
Please feel free to contact me on Twitter: @Malkudsi


