


Australian Dollar vs Japanese Yen Technical Forecast
- Bears show more sway after pressing AUD vs JPY to its lowest level in over a decade
- Will bears give up control?
Bears Ease Up
On Thursday, Aussie Dollar tested its lowest level in nearly eleven years against Japanese Yen at 59.90. In the following day, the market recovered some of its losses then closed above 64.00 handle.
Alongside that, the Relative Strength Index (RSI) abandoned oversold territory, highlighting weaker downtrend move.
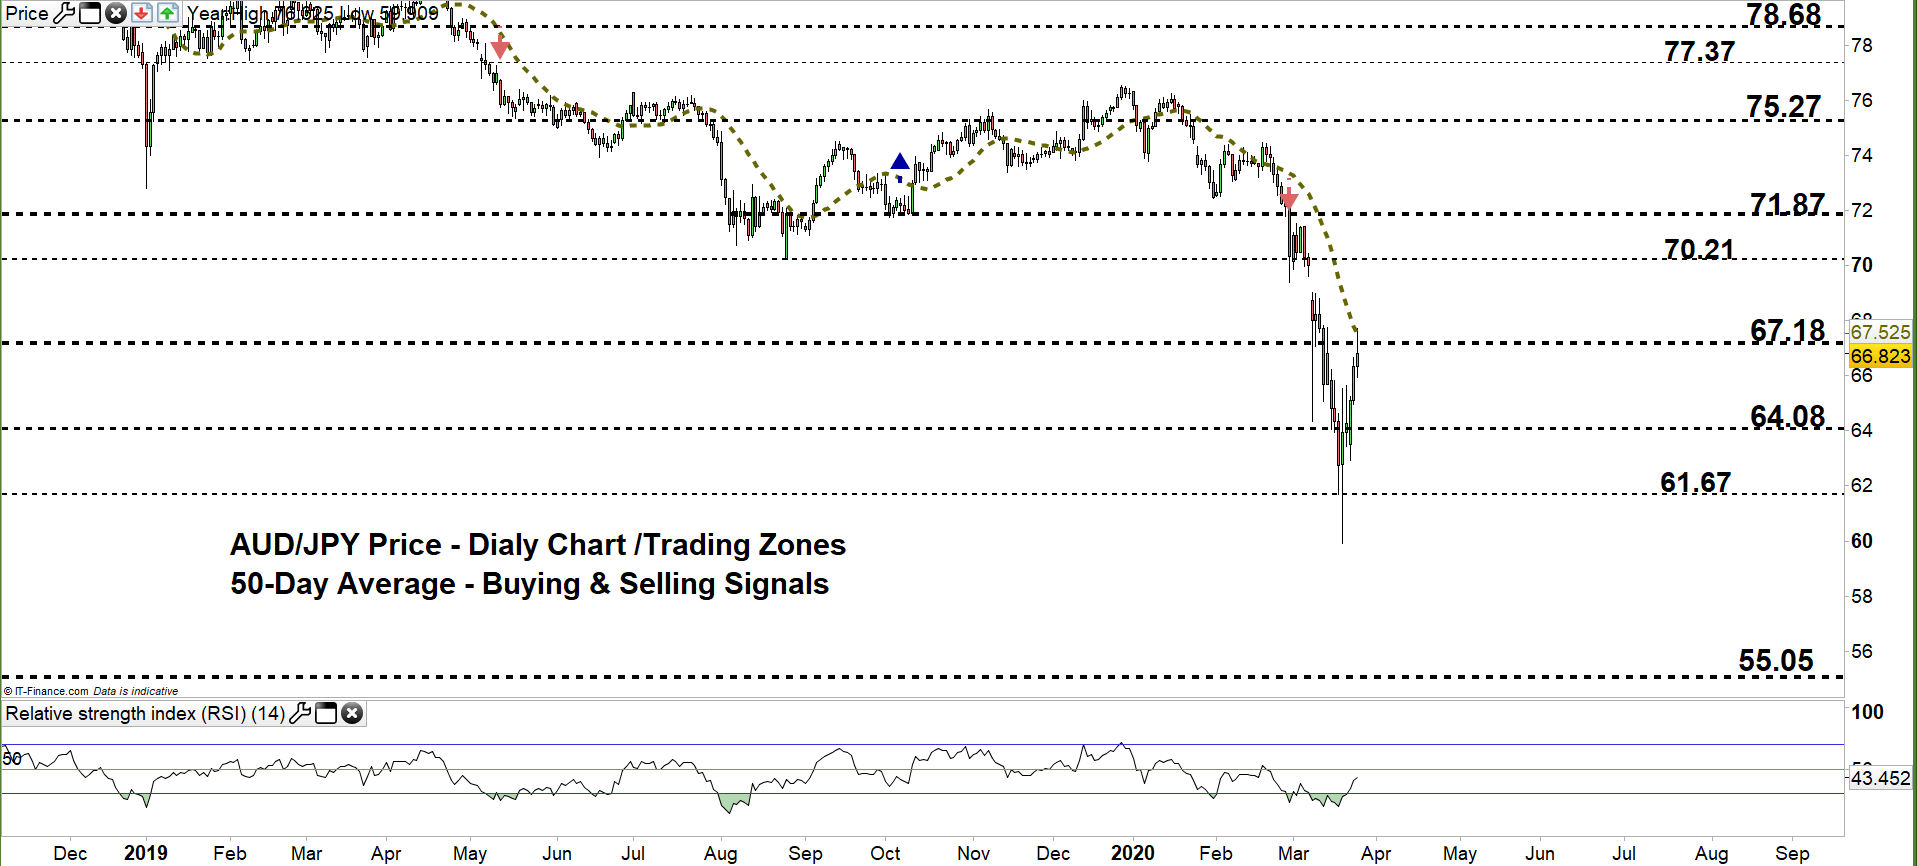
AUD/JPY DAILY PRICE CHART (Oct 11, 2018 – Mar 25, 2020) Zoomed OUT

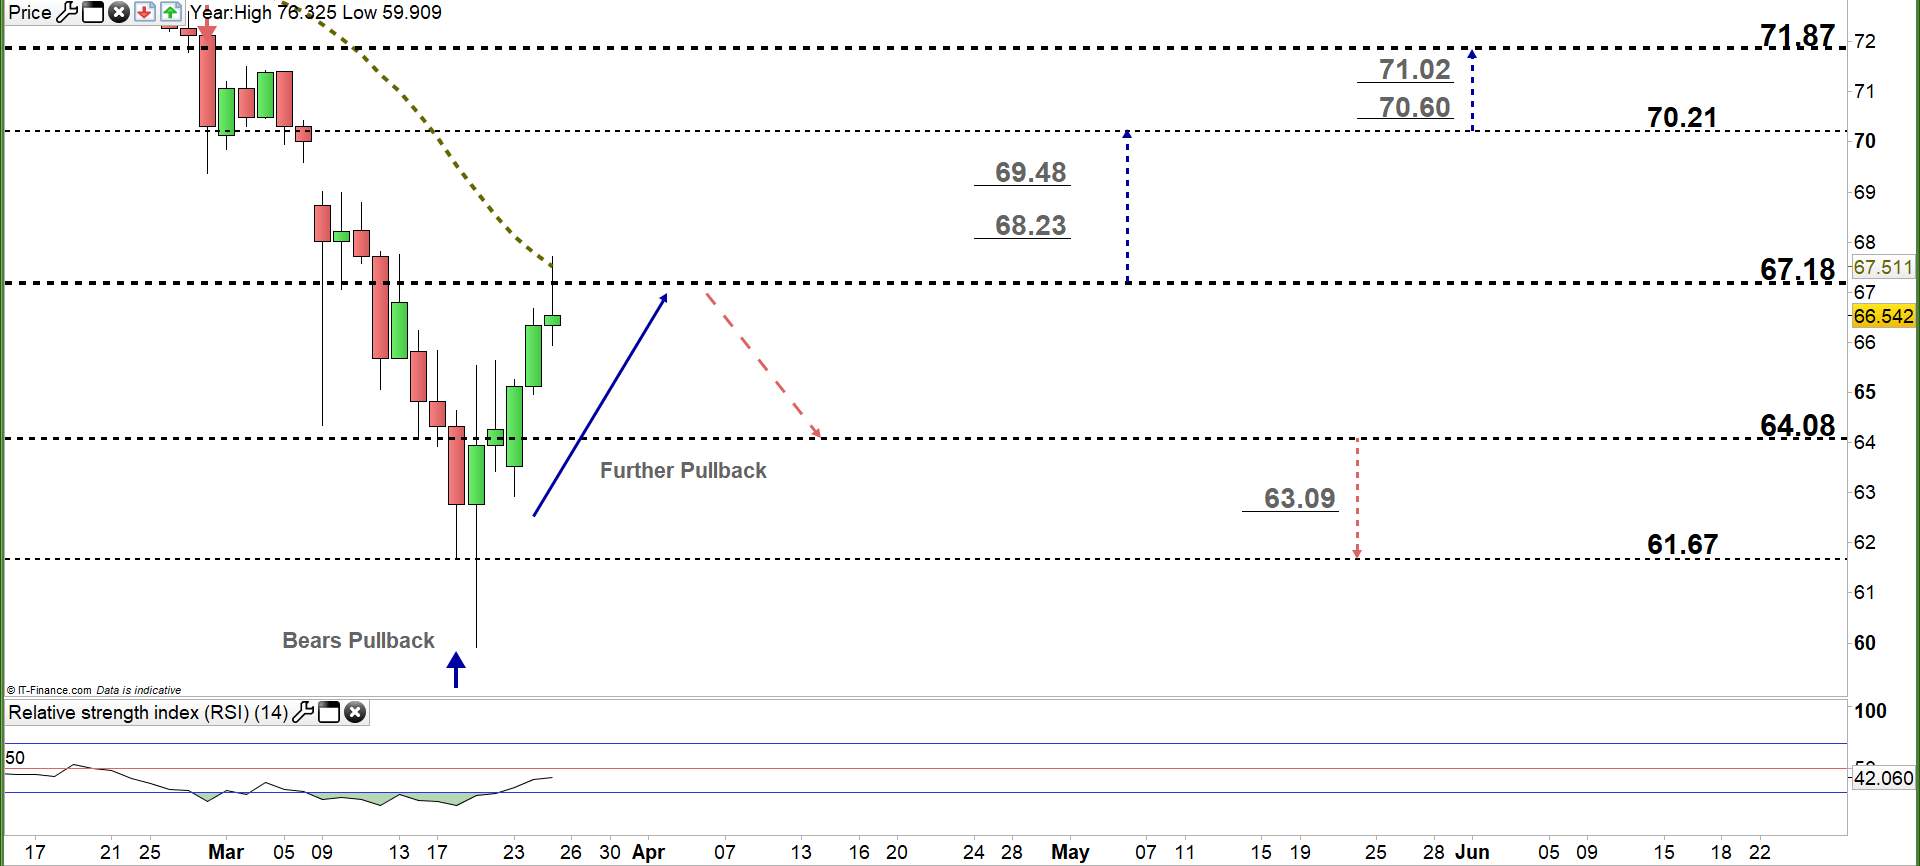
AUD/JPY DAILY PRICE CHART (FEB 17 – Mar 25, 2020) Zoomed IN
Looking at the daily chart, we noticed in late February AUD/JPY started a downtrend move creating lower highs with lower lows. By the end of last week, the market rebounded then rose to current trading zone 64.08- 67.18 as bears seemed to cover.
Today, the price has tested the high end of the zone. Therefore, a close above the high end could rally AUDJPY towards 70.21. Further close above that level might extend the rally towards 71.87. That said, the weekly resistance levels underscored on the chart (zoomed in) should be considered as some traders could exit/join the marker around these points.
In turn, any failure in closing below the high end could reverse the pair’s direction towards the low end of the zone. Further close below that level indicates that bears may come back and press towards 61.67. In that scenario, the weekly support levels printed on the chart should be watched closely.

AUD/JPY Four-Hour PRICE CHART (Mar 11– Mar 25, 2020)
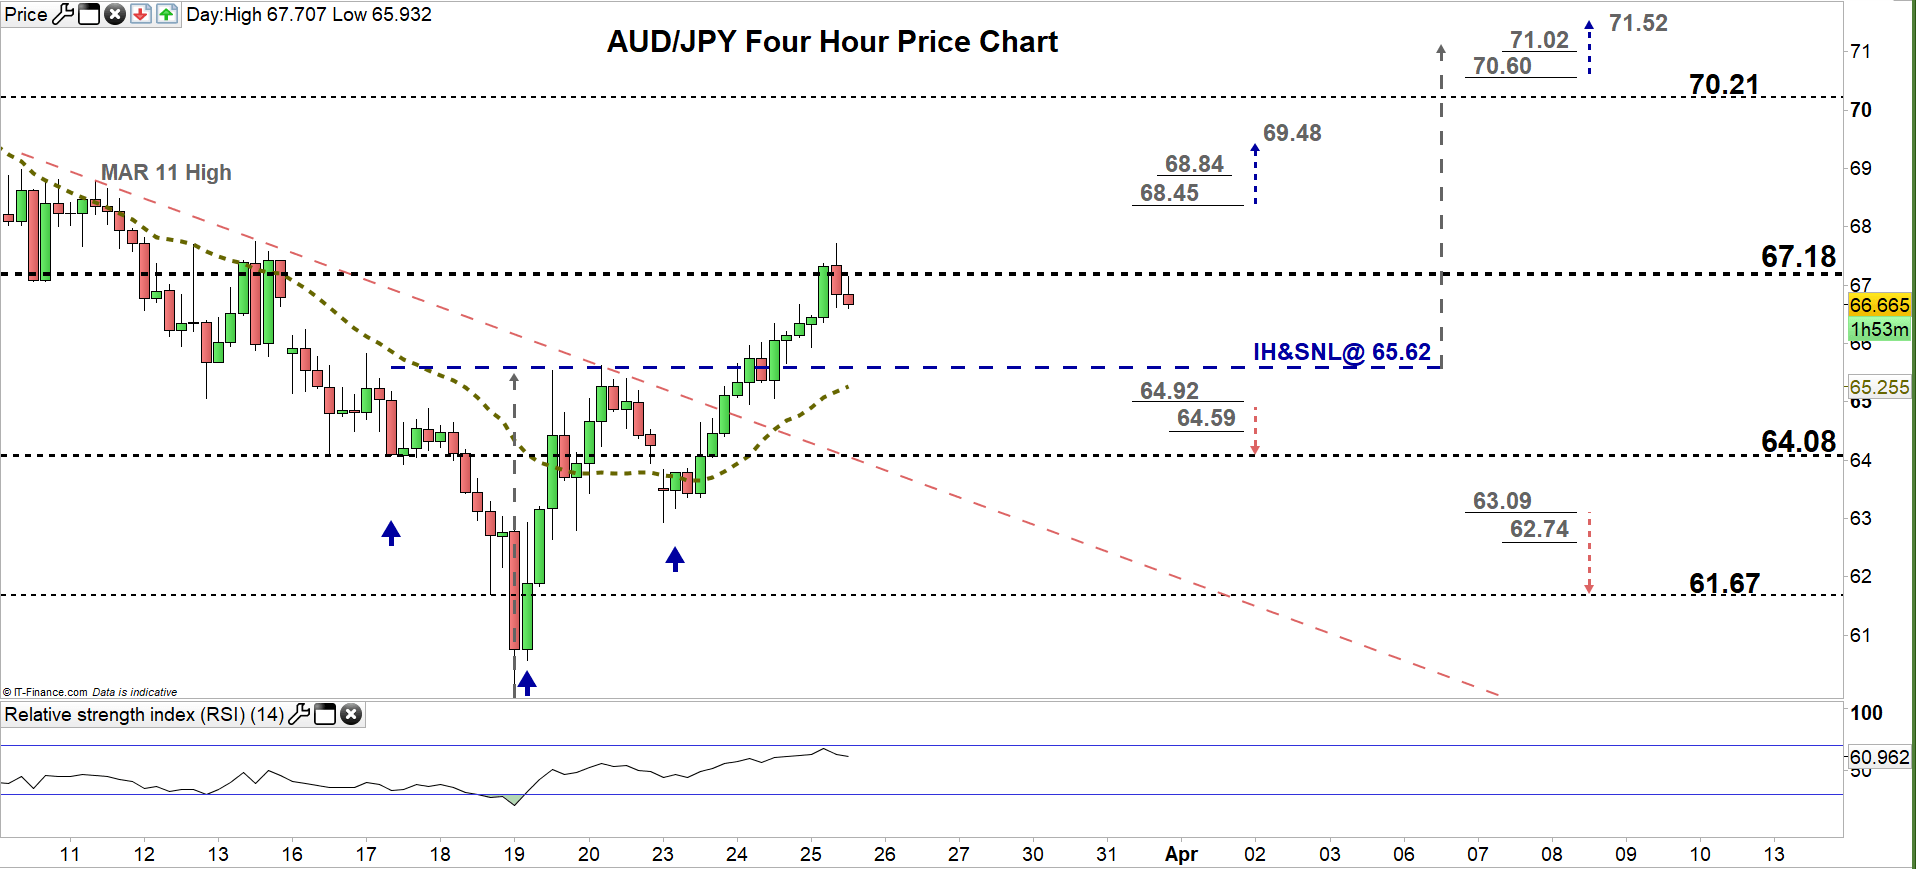
From the four- hour chart, we noticed that on Monday AUD/JPY generated a bullish signal as violated the downtrend line originated from the March 11 high at 68.79. Later on, the market rallied eyeing a test of the neckline of inverted head and shoulders pattern. The price could rally towards 71.00 handle if remains above 65.62.
Thus, a break above 68.45 would provide another bullish signal. This may push AUDJPY towards 69.48. Although, the weekly resistance level underlined on the chart would be worth monitoring. On the other hand, a break below 64.92 could send the pair towards the low end of current trading zone discussed above on the daily chart. Nevertheless, the daily support level marked on the chart should be watched closely.
See the chart to find out more about key levels Cable would encounter in a further bearish /bullish scenario.

Written By: Mahmoud Alkudsi
Please feel free to contact me on Twitter: @Malkudsi


