AUD Analysis and Talking Points
- AUD/USD | Risks Larger Reversal with 200DMA in Focus
- AUD/NZD | Range Remains Tight, Outlook Favours Upside
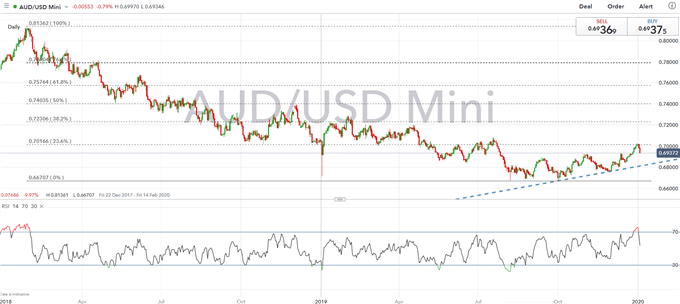
AUD/USD | Risks Larger Reversal with 200DMA in Focus
The pair has extended its bearish reversal from the 23.6% fib at 0.7016. As such, AUD/USD is testing the 0.6930-40 support zone, which represents the October 31st and December 13th peaks respectively. With the Australian Dollar dipping on the back of renewed geopolitical tensions in the middle east, focus is on the response from Iran, whereby a retaliation could place further pressure on the Aussie and thus leave the currency at risk of falling towards the 200DMA situated at 0.6897. Given the appreciation in the pair over the past month we do not rule out a larger reversal in the pair, which could see 0.6866 (50DMA) tested. On the domestic front, trade balance and retail sales data are scheduled for January 9th and 10th.
Implied weekly range (0.6870 – 0.7000)
| Support | Resistance | ||
|---|---|---|---|
| 0.6930-40 | Support Zone | 0.7000 | - |
| 0.6897 | 200DMA | 0.7016 | 23.6% Fib |
| 0.6866 | 50DMA | 0.7030 | Dec 2019 High |
AUD/USD Price Chart: Daily Time Frame (Dec 2017 –Jan 2020)

Source: IG
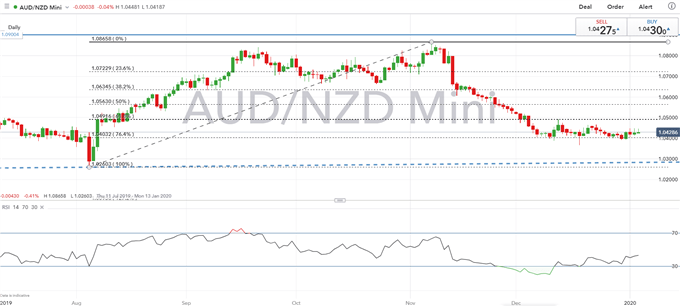
AUD/NZD | Range Remains Tight, Outlook Favours Upside
Given the lack of domestic data from both Australia and New Zealand throughout the holiday period, AUD/NZD has continued to trade within a relatively narrow range as both currencies tend to move in lockstep on external factors. That said, the narrative of diverging monetary policy between the RBA and RBNZ, which has resulted in the cross trading at the low 1.04s we feel this is somewhat overdone. Therefore, we see tactical upside in AUD/NZD towards 1.0550-1.0600, particularly with momentum indicators showing that the bearish bias is easing. The first hurdle on the topside however, is situated at 1.0491, which marks the 61.8% Fibonacci retracement, while on the downside, support is at the 1.0400 handle.
AUD/NZD Price Chart: Daily Time Frame (Jul 2019 – Jan 2020)

Source: IG
--- Written by Justin McQueen, Market Analyst
To contact Justin, email him at Justin.mcqueen@ig.com
Follow Justin on Twitter @JMcQueenFX


