


NZD Analysis and Talking Points
See the DailyFX FX forecast to learn what will drive the currency throughout the quarter.
NZDUSD | RBNZ Surprise Slams NZDUSD
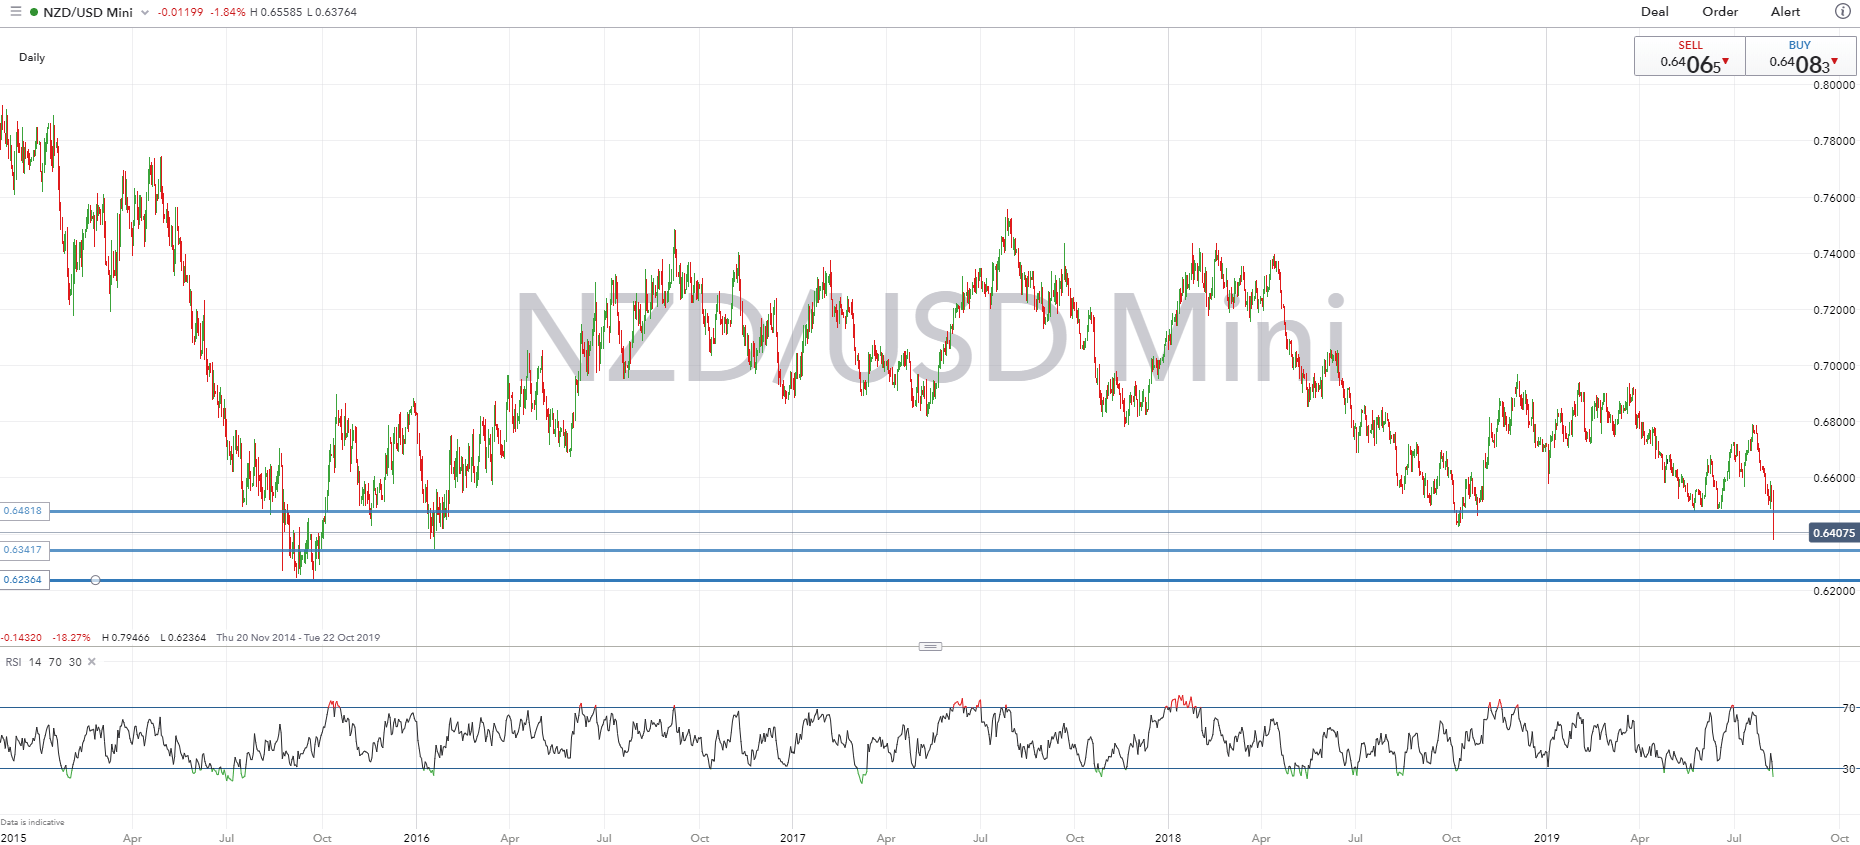
NZDUSD has been slammed following the surprise decision by the RBNZ to cut rates by 50bps (Exp. 25bps). Consequently, the pair broke through key support at 0.6480 before testing the psychological 0.6400 handle. Momentum indicators as signalled by the DMI are bearishly aligned, however, given the size of the drop we do not rule out some slight relief on profit taking. Gains are likely to be shallow as risks remain tilted to the downside for the pair. As such, a closing break below 0.6400 raises scope for a test of the 0.6340-50 support zone.
NZDUSD PRICE CHART: Daily Time Frame (Nov 2014 – Aug 2019)
AUDNZD | Battles Resistance Following Bullish Bounce
Following yesterday’s fresh 2019 low, AUDNZD has since recovered sharply with momentum indicators on the daily time frame flipping to positive. However, trend signals are yet to confirm whether this is the beginning of a bullish uptrend. The cross is now facing a plethora of resistance with the 23.6% Fib situated at 1.0486, while the 100 and 200DMAs reside at 1.0516-20 respectively, which in turn risks denting a further follow through in the recent upside.
AUDNZD PRICE CHART: Daily Time Frame (Jul 2018 – Aug 2019)

--- Written by Justin McQueen, Market Analyst
To contact Justin, email him at Justin.mcqueen@ig.com
Follow Justin on Twitter @JMcQueenFX


