


AUD Analysis and Talking Points
- AUDUSD | Key Support in Focus
- AUDJPY | Trend Signals Weak, Topside Resistance Holds
- AUDNZD | Possible Bottom as Key Support Remains Firm
See our Q1 FX forecast to learn what will drive the currency throughout the rest of the year.
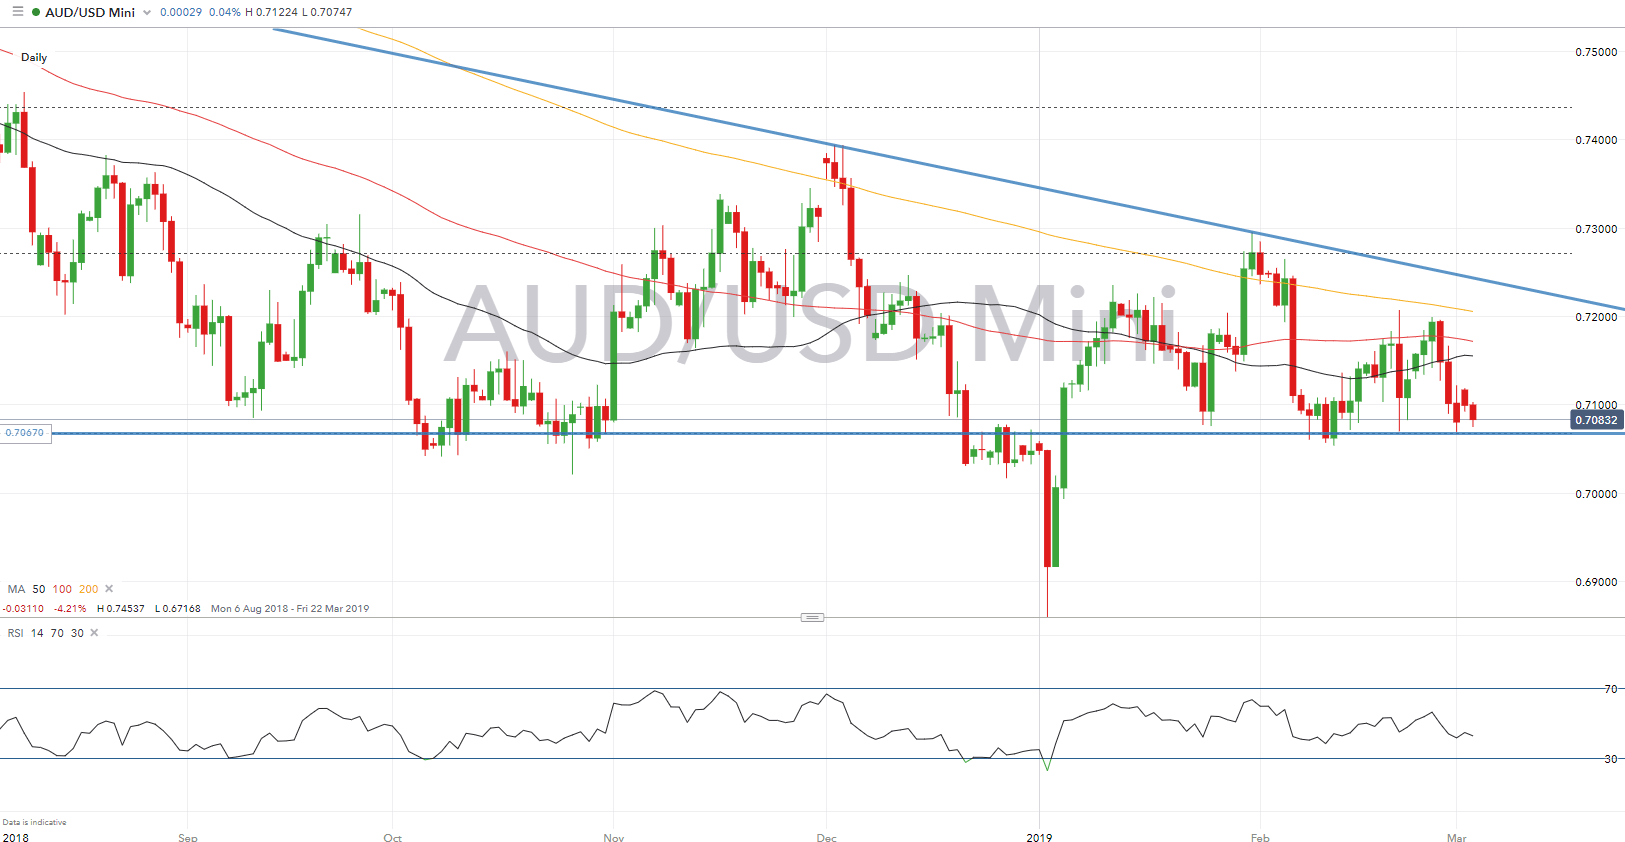
AUDUSD | Key Support in Focus
AUDUSD hovering below 0.7100 sees key support at 0.7067, which marks the 23.6% Fibonacci retracement, a move below would see a test of support at 0.7050. DMIs continue to show that the outlook remains tilted to the downside, with rallies in the pair likely to be capped at 0.7150 and 0.7200.
AUDUSD PRICE CHART: Daily Time Frame (Aug 2018 – Mar 2019)
AUDJPY | Trend Signals Weak, Topside Resistance Holds
AUDJPY continues to trade below the 80.00, which keeps the outlook bearish albeit mildly so as momentum indicators ease. Alongside this, trend signals are weak, consequently, implying that AUDJPY may remain relatively range-bound in the near-term. As topside resistance at 79.80-80.00 holds a large pullback could see support at 78.30-50 come into focus.
AUDJPY PRICE CHART: Daily Time Frame (Oct 2018– Mar 2019)

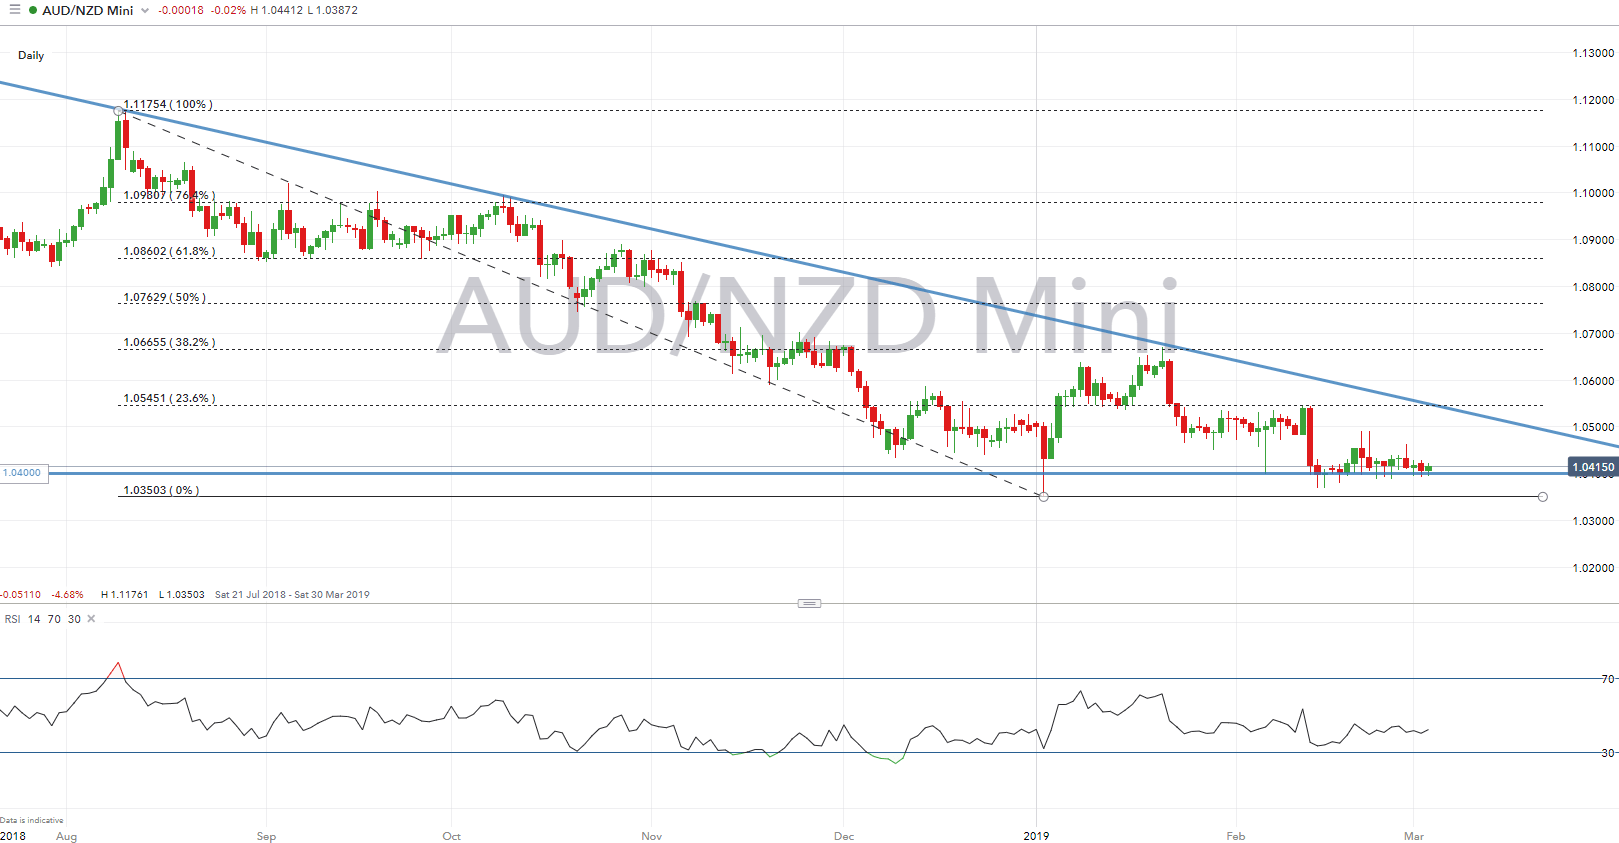
AUDNZD | Possible Bottom as Key Support Remains Firm
Dips below key support at 1.04 has failed to spark further selling in AUDNZD and given that trend signals remain weak, the 1.04 could continue to hold, further suggesting that the cross could have based out at 1.0370. However, while this may have been the case, there is little in the way of tentative signs that the cross will see in notable recovery. Topside resistance resides at 1.05, which marks the 50DMA.
AUDNZD PRICE CHART: Daily Time Frame (Jul 2018 – Mar 2019)
--- Written by Justin McQueen, Market Analyst
To contact Justin, email him at Justin.mcqueen@ig.com
Follow Justin on Twitter @JMcQueenFX


