


EURUSD chart analysis:
- The candlestick chart of EURUSD shows an outside range day Wednesday, suggesting a move to the upside after the recent weakness of the EURUSD price.
- The RSI also rose, as did volume, adding conviction to the signal.
EURUSD chart bullish after outside range day
The EURUSD chart is looking bullish after an outside range day Wednesday, when the high was higher than Tuesday, the low was lower and the close was higher.
EURUSD Price Chart, Daily Timeframe (October 5 – November 29, 2018)
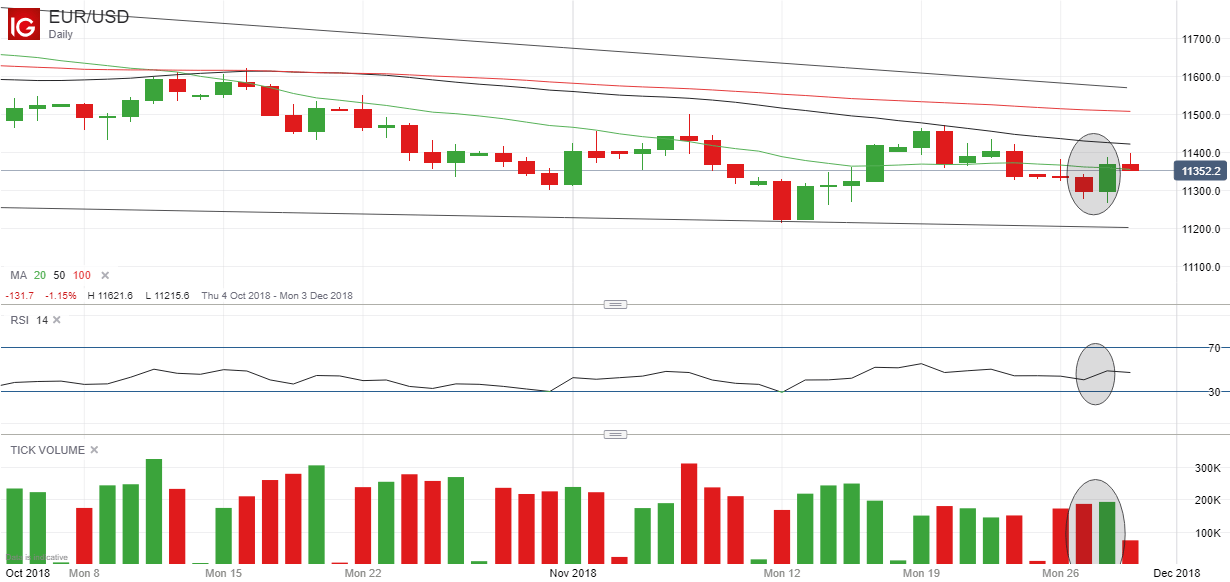
The EURUSD price has been falling since it hit a high of 1.1816 on September 24 so the chart pattern can be seen as a likely predictor of a trend change higher rather than as a continuation signal.
Moreover, as the chart above shows, the 14-day relative strength indicator (RSI) also moved up on Wednesday and volume was higher too, reinforcing the bullish message.
Resources to help you trade the forex markets
Whether you are a new or an experienced trader, at DailyFX we have many resources to help you:
- Analytical and educational webinars hosted several times per day,
- Trading guides to help you improve your trading performance,
- A guide specifically for those who are new to forex,
- And you can learn how to trade like an expert by reading our guide to the Traits of Successful Traders.
--- Written by Martin Essex, Analyst and Editor
Feel free to contact me via the comments section below, via email at martin.essex@ig.com or on Twitter @MartinSEssex


