


DOW JONES OUTLOOK – TALKING POINTS:
- Dow Jones down most in 13 months on “Omicron” Covid variant
- Breaking near-term support might expose 6-month range bottom
- Reclaiming a foothold above 35547 needed to neutralize sellers
Foundational Trading Knowledge
Understanding the Stock Market
Recommended by Ilya Spivak
The Dow Jones Industrial Average equity index tracking 30 blue-chip US companies plunged on Friday, shedding an eye-watering 2.49 percent and marking the largest one-day loss in 13 months. The plunge came as the World Health Organization (WHO) identified a new worrying variant of Covid-19, dubbed “Omicron”.
The mutant virus seems to have spread significantly in Africa. While vaccine efficacy against it is an open question, a UK health official warned they will “almost certainly” prove less potent. A slew of countries promptly moved restrict travel and investors rushed for the exits at the prospect of another economic shutdown.
Prices are now testing major inflection-zone support anchored at 34690. Breaking below that may set the stage for an extension lower to challenge the floor for the range prevailing in the second half of the year, in the 32902-33383 region. A bit of friction may be seen at the 34170-398 congestion area along the way.
Immediate resistance is at 35091, a minor barrier that has acted as short-term pivot since August. Above that, a meatier resistance block is capped at 35547. Overcoming the latter threshold – with confirmation on a daily closing basis – seems like a prerequisite for neutralizing near-term selling pressure.
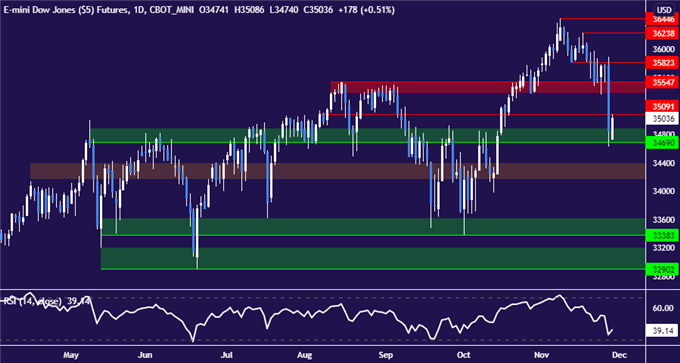
Dow Jones futures daily chart created with TradingView
DOW JONES TRADING RESOURCES
- Just getting started in the markets? See our free trading guides
- What is your trading personality? Take our quiz to find out
- Join a free webinar and have your trading questions answered
--- Written by Ilya Spivak, Head of Greater Asia at DailyFX.com
To contact Ilya, use the comments section below or @IlyaSpivak on Twitter


