


Dow Jones Talking Points:
- The Dow Jones Industrial Average has started Q2 with continuation of Q1 strength, breaking above a bull pennant formation while rallying up for a test of resistance around five-month-highs.
- Key for this theme of Dow strength has been recovery in the largest DJIA component of Boeing (BA), which has held a confluent zone of Fibonacci support despite the negative drivers around the company that showed up in March.
- DailyFX Forecasts on a variety of currencies such as the US Dollar or the Euro are available from the DailyFX Trading Guides page. If you’re looking to improve your trading approach, check out Traits of Successful Traders. And if you’re looking for an introductory primer to the Forex market, check out our New to FX Guide.
Dow Rally Extends to Five-Month Highs
The US equity rally has extended into the opening days of Q2, and this follows a very strong showing in Q1 as the previous quarter’s slump was soundly broken; and prices in the Dow are trading near five-month-highs. The fourth quarter of last year brought a stark change-of-pace to the risk trade, as a comment from Chair Powell in the opening days of the quarter alluded to a continued pace of tightening at the Fed looking-forward into 2019. But as the Dow turned-over, FOMC commentary started to get more and more passive until, eventually, the bank did away with expectations for rate hikes in 2019.
This has helped the US equities to run-up to a fresh five-month and 2019 highs: The Dow Jones continues to lag-behind the more broad-based S&P 500 due to setbacks in the index’s largest component of Boeing, which currently comprises more than 10% of the Dow Jones Industrial Average. In the Dow, prices are caught at the November swing-high, and that resistance has held through the Q2 open following a strong showing on Monday.
Dow Jones Industrial Average: Daily Price Chart
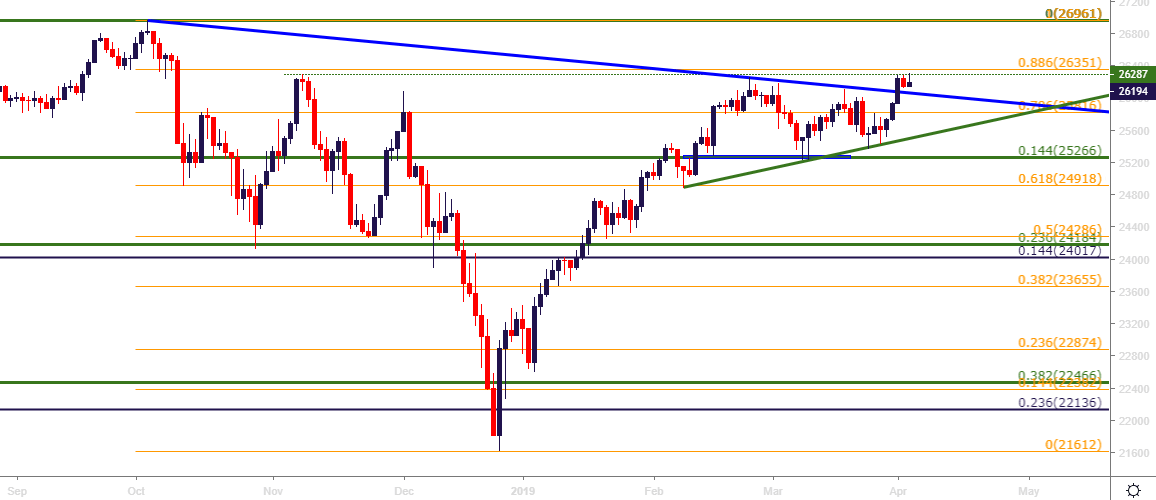
Chart prepared by James Stanley
As previously discussed, items around Boeing have taken a toll on the Dow over the past month following the tragedy in Ethiopia. Prices in BA posed a fast and aggressive drop down to a key area of confluent support on the chart; and despite multiple attempts from sellers to break-through, that support zone has continued to hold the lows as recovery has taken-hold in the stock. This support zone is derived from two different Fibonacci levels creating an area of confluence on the chart. The price of 364.85 is the 23.6% retracement of the 2016-2019 major move; and the level of 369.24 is the 50% marker of the 2018 low to the 2019 high. Prices are now testing back-above the 38.2% marker of the latter Fibonacci study, indicating bullish continuation potential.
Boeing (BA) Eight-Hour Price Chart
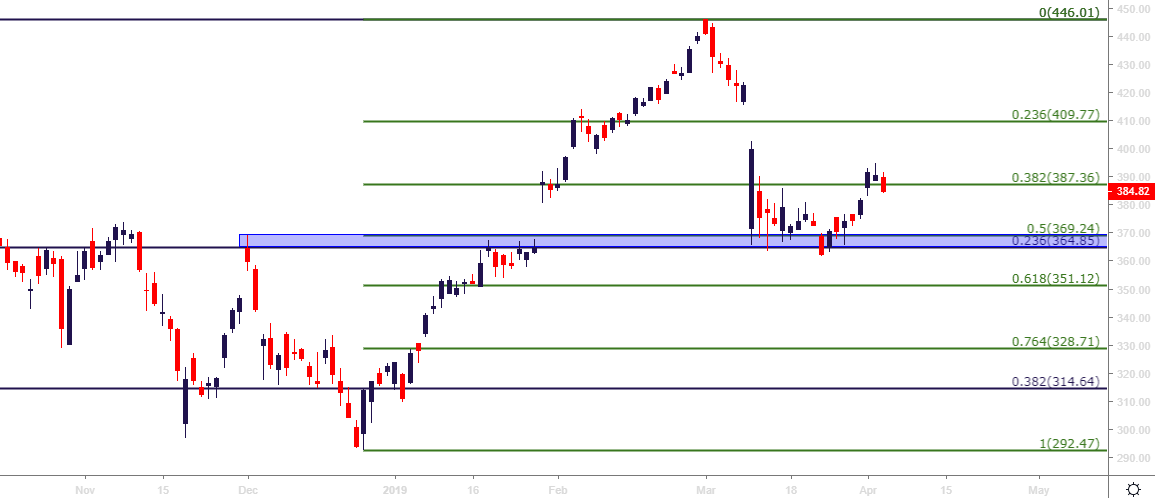
Chart prepared by James Stanley
Dow Jones Near-Term Strategy
The primary complication at this point around the Dow appears to be one of chart proximity. Prices have moved very far away from the most recent swing-low set just last week around 25,437. This can make the prospect of bullish trend strategies a more challenging given the wider stop that would be difficult to justify given proximity to resistance.
Breakout strategies, on the other hand, may remain as an option given the persistence of bulls so far this week. Should prices test above the current area of resistance, potential stopping points at 26,351 and 26,574 could remain of interest for topside target potential. Beyond that is a potential swing-level around 26,688 and then the all-time-high in the index is exposed at 26,961.
Should a deeper pullback develop: Support potential could be sought out at an aggressive area of support potential around 26,067-26,110. A bit deeper, the prior areas of support could be re-utilized, and those run from 25,816-25,891 and 25,595-25,632, respectively.
DJIA: Dow Jones Four-Hour Price Chart

Chart prepared by James Stanley
You may also be interested in:
Day Trading the Dow Jones: Strategies, Tips & Trading Signals
To read more:
Are you looking for longer-term analysis on the U.S. Dollar? Our DailyFX Forecasts have a section for each major currency, and we also offer a plethora of resources on USD-pairs such as EUR/USD, GBP/USD, USD/JPY, AUD/USD. Traders can also stay up with near-term positioning via our IG Client Sentiment Indicator.
Forex Trading Resources
DailyFX offers a plethora of tools, indicators and resources to help traders. For those looking for trading ideas, our IG Client Sentiment shows the positioning of retail traders with actual live trades and positions. Our trading guides bring our DailyFX Quarterly Forecasts and our Top Trading Opportunities; and our real-time news feed has intra-day interactions from the DailyFX team. And if you’re looking for real-time analysis, our DailyFX Webinars offer numerous sessions each week in which you can see how and why we’re looking at what we’re looking at.
If you’re looking for educational information, our New to FX guide is there to help new(er) traders while our Traits of Successful Traders research is built to help sharpen the skill set by focusing on risk and trade management.
--- Written by James Stanley, Strategist for DailyFX.com
Contact and follow James on Twitter: @JStanleyFX


