


Talking Points:
- Gold Prices Rebound on US Dollar Weakness
- Next Intraday Resistance Found at $1,250.06
- Looking for additional trade ideas for gold and commodities markets? Read our 2017 Market Forecast
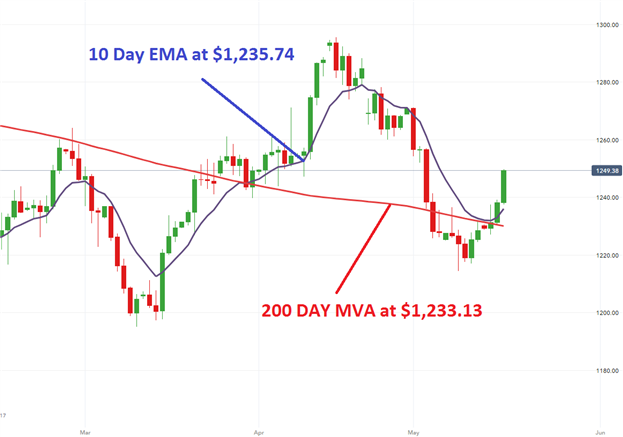
Gold prices are rebounding and trading to new weekly highs today, as the US Dollar continues to decline. Technically gold prices may now be seen as trending higher in both the short and long term. Yesterday’s bullish breakout saw gold closing back above both the 200 day MVA (simple moving average) and the 10 day EMA (exponential moving average). Currently the 10 day EMA is found at $1,235.74, and should be referenced as a value of support if prices continue to advance.
In the event of a price reversal, traders should first look for gold to trade back below the 10 day EMA. This would signify a bearish shift in momentum, and open prices to retest the 200 day MVA which is now found at $1,230.04. A move beyond $1,230.04 would have longer term bearish implications, at which point traders may begin to target the standing May low at $1,233.13.
Gold Prices, Daily Chart with averages
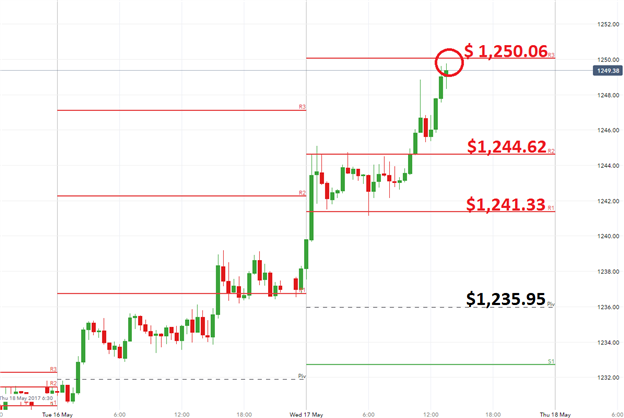
Intraday analysis now has gold prices testing today’s R3 pivot found at $1,250.06. This pivot marks the last point of intraday resistance, and a breakout through $1,250.06 should be seen as technically significant. In a continued bullish scenario, traders may look for prices to next test key values of resistance including the May 3rd high at $1,257.05.
In the event of a bearish reversal, traders should look for gold to reverse beneath today’s R3 pivot. This opens up the commodity to trade back beneath both the R2 and R1 pivots, found at $1,244.62 and $1,241.33 respectfully. Traders should note that today’s central pivot is found at $1,235.95. While a move below this point would suggest a change in short term momentum, it would not place gold beneath its 10 day EMA however.
Gold Price, 30 Minute Chart and Pivots
--- Written by Walker, Analyst for DailyFX.com
To Receive Walkers’ analysis directly via email, please SIGN UP HERE
See Walker’s most recent articles at his Bio Page.
Contact and Follow Walker on Twitter @WEnglandFX.


