


Talking Points:
- USD/CAD Reaches Resistance Under 1.3500
- Intraday Market Support Found at 1.3408
- Looking for more trade ideas for the Forex market? Register for our Q2 price forecast HERE.
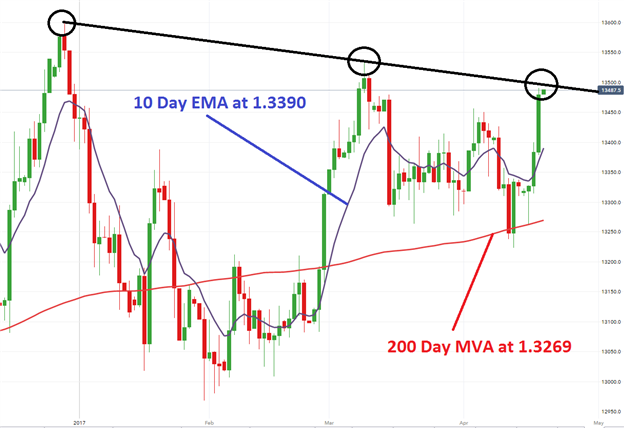
After rallying for the 4th consecutive session this week, the USD/CAD is quickly closing in on a key point of technical resistance near 1.3500. This line of resistance can be seen on the graph below as a descending trendline, and has been created by connecting a series of lower highs staring with the December 2016 high at 1.3581. If prices breakout above resistance, it should be seen as a strong continuation signal for the pairs ongoing uptrend. For reference, the pair remains above both its 10 day EMA (exponential moving average) at 1.3390 and 200 day MVA (simple moving average) at 1.3269.
If prices are rejected near present levels, traders will first look for the USD/CAD to breakout below the previously mentioned 10 day EMA. A move back below 1.3390 should be seen as significant as the USD/CAD would have then retraced the majority of yesterday’s 112 pip advance. In this bearish scenario, traders may next set longer term targets back towards the 200 day MVA at 1.3269.
USD/CAD, Daily Chart & Averages
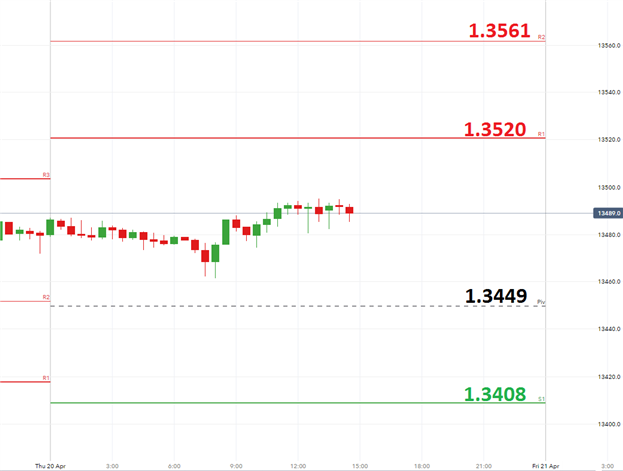
Intraday market analysis has the USD/CAD trading above its central pivot at 1.3449. Typically this is seen as bullish in the short term, and if prices trend higher the next point of resistance is found at the R1 pivot at 1.3520. This is followed by both the R2 and R3 pivots found at 1.3561 and 1.3632 respectively. Traders should note that if the USD/CAD reaches any of these intraday points of resistance, the pair will also be breaking out from the longer term trendline mentioned above.
In the USD/CAD reverses from present levels, traders should first look for the pair to trade back below its central pivot at 1.3449. A move to this point may suggest that the daily point of resistance near 1.3500 is holding, opening the pair to trade towards other points of intraday support. This includes both the S1 and S2 pivots found at 1.3408 and 1.3337 respectively.
USD/CAD, 30 Minute Chart & Pivots
--- Written by Walker, Analyst for DailyFX.com
To Receive Walkers’ analysis directly via email, please SIGN UP HERE
See Walker’s most recent articles at his Bio Page.
Contact and Follow Walker on Twitter @WEnglandFX.


