


Talking Points:
- USD/CAD trading around resistance at the 1.3150 level
- US ISM data and Crude Oil Inventories put the pair in focus today
The USD/CAD rebounded yesterday after finding support above the 1.30 handle, and currently trades around potential resistance below the 1.3150 figure.
The pair remained supported even though the US Dollar tumbled, perhaps due to influence of falling Oil prices pressuring its Canadian counterpart.
With the US ISM Non-Manufacturing data and Crude Oil Inventories ahead, the pair is in high focus.
Taking this into consideration, we look to find short term trading opportunities using the Grid Sight Index (GSI) indicator.
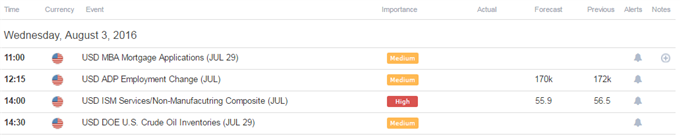
Click Here for the DailyFX Calendar
The US ISM Non-Manufacturing July figures are set to hit the wires 14:00 GMT. The diffusion index is expected to slightly down tick to 55.9 from the prior 56.5 print. The ISM numbers tend to have market moving impact, which could by even amplified this time around as the market digests the huge miss to US 2Q GDP estimates this Friday.
Given the fact that the pair staged a significant rebound yesterday despite US Dollar weakness might imply that the USD/CAD could be more vulnerable to upside surprises, that could help ease concerns over the US economy following the GDP report.
The official EIA weekly Crude Oil Inventories numbers seem like a huge event risk today. Economists are expecting a -1363K draw-down coming into today, versus the prior +1671K figure.
Crude Oil and USD/CAD 20-day correlation is sitting at -0.62 while 10-day correlation is at 0.0 at the time of writing. These figures might help shed light on the current dynamic in the pair. On the short end, the pair tumbled on intrinsic US Dollar weakness, but correlation remains strong on the longer outlook.
At the time the pair rebounded yesterday, other majors rallied versus the US Dollar and/or saw only a slight correction, this could mean that focus might now be coming back to Crude Oil prices as a key driver for price.
Taking this into consideration may imply that the USD/CAD could potentially be very vulnerable to any US Dollar strength at the moment, aggregated by further declines in Oil.
USD/CAD 5-Min GSI Chart: August 3, 2016

The USD/CAD is trading at a possible resistance area (see chart below), with GSI calculating even percentage of past movement to either side in the short term. The GSI indicator above calculates the distribution of past event outcomes given certain momentum patterns, and can give you a look at the market in a way that's never been possible before, analyzing millions of historical prices in real time. By matching events in the past, GSI describes how often the price moved in a certain direction.
You can learn more about the GSI here.
USD/CAD Technical Levels:

Click here for the DailyFX Support & Resistance tool
We use volatility measures as a way to better fit our strategy to market conditions. The USD/CAD is seeing reduced levels of volatility (on 14-day ATR study). In turn, this could imply that range bound trading plays might be appropriate. However, a combination of positive US data and weaker oil prices on the Crude Oil figures might set the stage for a possible breakout attempt on Friday’s NFPs.
USD/CAD 30-Min Chart: August 3, 2016

(Click to Enlarge)
The USD/CAD is trading at an area of possible resistance below the 1.3150 level. The pair might need to see a clear move above that level for the US Dollar to really pick up speed here.
Further levels of resistance on a move higher might be interim resistance at 1.3180, the 1.32 handle and a zone around the July high at about 1.3250, which the pair failed to break on the latest attempts.
The significant levels of interest on a move lower could be an area around 1.3080, 1.3050 and a zone above the 1.30 handle, followed by 1.2980 and 1.2950.
When price reaches those levels, short term traders might use the GSI to view how prices reacted in the past given a certain momentum pattern, and see the distribution of historical outcomes in which the price reversed or continued in the same direction. We generally want to see GSI with the historical patterns significantly shifted in one direction, which could potentially be used with a pre-determined bias as well.
A common way to use GSI is to help you fade tops and bottoms, and trade breakouts. That’s why traders may want to use the GSI indicator when price reaches those specific pre-determined levels, and fit a strategy that can offer a proper way to define risk. We studied over 43 million real trades and found that traders who do that were three times more likely to turn a profit. Read more on the “Traits of Successful Traders” research.
Meanwhile, the DailyFX Speculative Sentiment Index (SSI) is showing that about 48.2% of traders are long the USD/CAD at the time of writing. The SSI is mainly used as a contrarian indicator implying a slight long bias.
You can find more info about the DailyFX SSI indicator here
--- Written by Oded Shimoni, Junior Currency Analyst for DailyFX.com
To contact Oded Shimoni, e-mail oshimoni@dailyfx.com
Follow him on Twitter at @OdedShimoni


