


Talking Points:
- EUR/USD rejecting below the 1.1150 level after the BoE rate decision
- US CPI, Retail Sales and the University of Michigan’s Confidence Survey in high focus
The EUR/USD is trading below the 1.1150 figure (at the time this report was written) after rejecting higher prices following an initial push higher on yesterday’s BoE rate decision.
Inflation is in the spotlight today as CPI figures from both the Euro-Zone and the US headline the economic docket.
Taking this into consideration, we look to find short term trading opportunities using the Grid Sight Index (GSI) indicator.
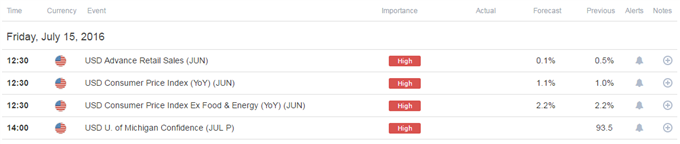
Click Here for the DailyFX Calendar
Euro-Zone Final Consumer Price Index figures are set to hit the wires in European trading hours. The headline figure is expected to remain unchanged from the flash print at 0.1%. Core CPI is expected to show an annual rise of 0.9%. The Euro-Zone CPI figures today might not have a significant impact, unless a very meaningful deviation hits the wires, as the market seems to continue to gauge the “Brexit” impact on the Euro-Zone, and the figures represent data mostly prior to the Brexit vote.
In contrast, the US inflation data appears more likely to spark some volatility. Fed rate hike bets have firmed this past week, perhaps on the backdrop of some Fed members continuing to push the possibility for a hike this year in their commentary, while also appearing to slightly downplay the “Brexit” impact on the US economy. Combined with positive bank earnings reports, “Brexit” worries might ease somewhat, which could help bring back focus to US monetary policy and in turn to domestic US data. Inflation is seemingly the “missing” piece for the Fed’s dual mandate.
A positive set of data from the US June CPI figures, Retail Sales and the University of Michigan inflation expectations figure could potentially see firming rate hike bets that could send the US Dollar higher. US news-flow has outperformed relative to forecasts since mid-May, which could imply a possible beat to expectations today.
EUR/USD 3-Min GSI Chart: July 15, 2016

The EUR/USD is trading at a resistance zone at the time of writing. Indeed, the GSI indicator is implying that 51% similar past momentum events have seen some downside movements. The indicator calculates the distribution of past event outcomes given certain momentum patterns, and can give you a look at the market in a way that's never been possible before, analyzing millions of historical prices in real time. By matching events in the past, GSI describes how often the price moved in a certain direction.
You can learn more about the GSI here.
EUR/USD Technical Levels:

Click here for the DailyFX Support & Resistance tool
We use volatility measures as a way to better fit our strategy to market conditions. The pair has seen reduced volatility as of late, and continues to trade sideways post “Brexit”. This could imply that some sort of fundamental catalyst may be required to see conviction to either side. Taking this into consideration might indicate that range bound trading ideas might be appropriate, but things could change after the aforementioned event risk for more breakout and trend oriented plays.
EUR/USD 30-Min Chart With SPX 500 Overlay: July 15, 2016
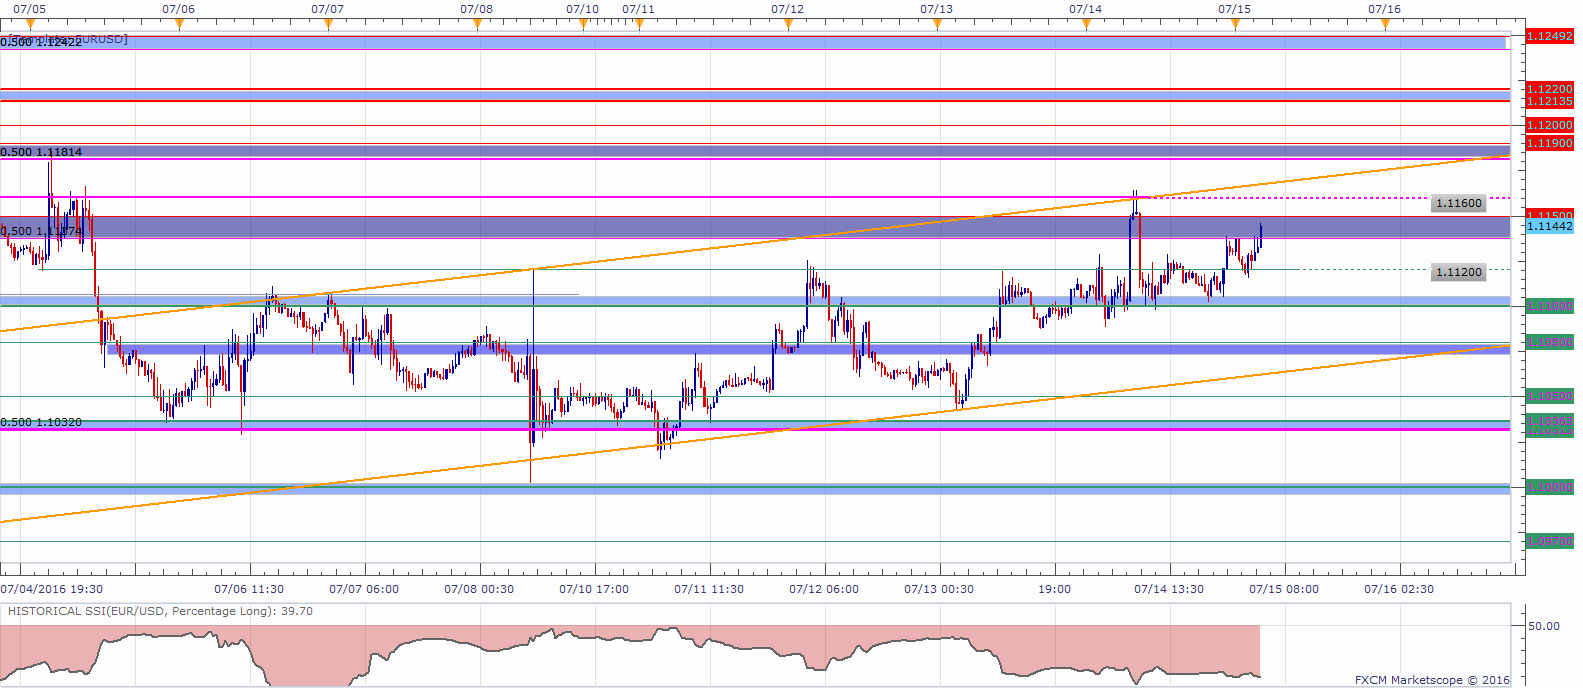
The EUR/USD is trading at what seem like a key area of resistance around the 1.1150 level (with a rejection at the 1.1160 level). Further levels of resistance on a move higher might be a zone below the 1.1190 level, the 1.12 handle, a zone below 1.1220 and the 1.1250 figure.
Levels of potential support on a move lower may be 1.1120, the 1.11 handle and a zone below 1.1080. If the price manages to move below those levels, focus might be put on 1.1050, 1.1030 and the big 1.10 figure.
When price reaches those levels, short term traders might use the GSI to view how prices reacted in the past given a certain momentum pattern, and see the distribution of historical outcomes in which the price reversed or continued in the same direction. We generally want to see GSI with the historical patterns significantly shifted in one direction, which could potentially be used with a pre-determined bias as well.
A common way to use GSI is to help you fade tops and bottoms, and trade breakouts. That’s why traders may want to use the GSI indicator when price reaches those specific pre-determined levels, and fit a strategy that can offer a proper way to define risk. We studied over 43 million real trades and found that traders who do that were three times more likely to turn a profit. Read more on the “Traits of Successful Traders” research.
Meanwhile, the DailyFX Speculative Sentiment Index (SSI) is showing that about 39.7% of traders are long the EUR/USD at the time of writing, apparently trying to sell the pullback from the “Brexit” fall. The range bound trading condition appear to be in line with retail traders more successful periods (see the “Traits of Successful Traders” research), which could imply weakness ahead.
You can find more info about the DailyFX SSI indicator here
--- Written by Oded Shimoni, Junior Currency Analyst for DailyFX.com
To contact Oded Shimoni, e-mail oshimoni@dailyfx.com


