


Talking Points:
- AUD/USD pushed higher after the Australian employment data hit the wires
- China GDP figures the main event risk ahead for the pair as the BoE rate decision is being “digested” by the markets
The AUD/USD is trading around possible resistance at the 0.7650 level at the time of writing, after moving higher following the Australian employment data that signaled a strong gain in full time jobs.
China GDP figures headline the economic docket as an event risk for the Aussie, but effect on risk trends from the BoE rate decision could see an influence for the pair as well.
Taking this into consideration, we look to find short term trading opportunities using the Grid Sight Index (GSI) indicator.
Click Here for the DailyFX Calendar
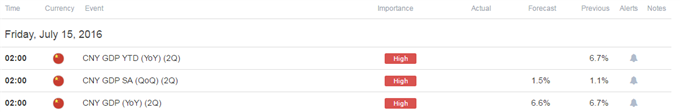
China 2Q GDP figures are in high focus looking ahead. The year-on-year 2Q print is expected to show a slight easing to 6.6% from the prior 6.7% figure. The figures are of key importance in the context of slowing global growth as China continues to be a major cause for concern. Some skepticism surrounds the remarkably consistent data, but that doesn’t seem to imply that the figures will be overlooked.
A beat to expectation might be interpreted as supportive for the Australian Dollar due to the close trading relations between the countries, and even more so on possible positive influence on risk trends. Indeed, 10-day correlation between the AUD/USD and the SPX 500 stands at an impressive 93% at the time of writing.
In this context, the BoE rate decision could prove significant for the pair as well. The markets have seen a surge in risk assets, with the S&P 500 hitting all-time highs, perhaps on the prospects of a search for yield as bonds yields hit record lows across the board on the backdrop of the Brexit decision and possibility for further stimulus by central banks. A hit to risk assets seems likely to send the pair lower, while a “risk on” environment could see a continuation higher.
AUD/USD 5-Min GSI Chart: July 13, 2016

The AUD/USD is trading between the 0.7650 resistance and 0.7600 support at the time of writing (see chart below). The GSI indicator above might be used when price reaches levels of interest. The indicator calculates the distribution of past event outcomes given certain momentum patterns, and can give you a look at the market in a way that's never been possible before, analyzing millions of historical prices in real time. By matching events in the past, GSI describes how often the price moved in a certain direction.
You can learn more about the GSI here.
AUD/USD Technical Levels:

Click here for the DailyFX Support & Resistance tool
We use volatility measures as a way to better fit our strategy to market conditions. The market seems likely to see heightened volatility with the even risk ahead, which could imply that breakout trades are preferable in the short term.
AUD/USD 30-Min Chart With SPX500 Overlay: July 14, 2016

The AUD/USD is trading at what seems like a key resistance zone below the 0.7650 level. Further levels of resistance on a move higher might be 0.7674 followed by the 0.77 handle, an area below 0.7770 and the 0.78 figure.
Levels of potential support on a move lower may be 0.7600, followed by an area below the 0.7550 figure, the 0.75 handle, 0.7473 and a zone below 0.7450.
When price reaches those levels, short term traders might use the GSI to view how prices reacted in the past given a certain momentum pattern, and see the distribution of historical outcomes in which the price reversed or continued in the same direction. We generally want to see GSI with the historical patterns significantly shifted in one direction, which could potentially be used with a pre-determined bias as well.
A common way to use GSI is to help you fade tops and bottoms, and trade breakouts. That’s why traders may want to use the GSI indicator when price reaches those specific pre-determined levels, and fit a strategy that can offer a proper way to define risk. We studied over 43 million real trades and found that traders who do that were three times more likely to turn a profit. Read more on the “Traits of Successful Traders” research.
Meanwhile, the DailyFX Speculative Sentiment Index (SSI) is showing that about 44.3% of traders are long the AUD/USD at the time of writing, apparently trying to pick a top, implying possible further strength ahead on a contrarian basis.
You can find more info about the DailyFX SSI indicator here
--- Written by Oded Shimoni, Junior Currency Analyst for DailyFX.com
To contact Oded Shimoni, e-mail oshimoni@dailyfx.com


