


Talking Points:
- EUR/USD finds resistance at the 1.11 handle to see two failed breakout attempts
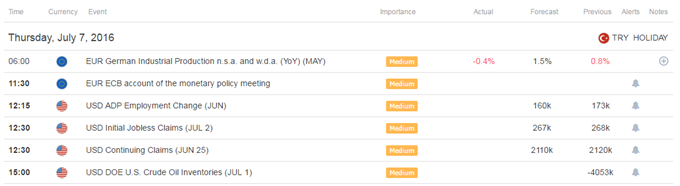
- ECB’s June Meeting Minutes appear unlikely to generate significant impact
The EUR/USD appears to be trading sideways between well-defined technical levels after falling sharply following the “Brexit” decision. The pair has seen two breakout attempts fail at the 1.11 handle in the last couple of trading days, and currently looks under pressure in early London trading hours.
The ECB’s June Account of Monetary Policy release today seems unlikely to generate significant impact, since the decision was made prior to the “Brexit” vote, while the market might hold off on significant directional conviction ahead of the US NFPs tomorrow.
Taking this into consideration, we look to find short term trading opportunities using the Grid Sight Index (GSI) indicator.
Click Here for the DailyFX Calendar
June’s ECB Account of Monetary Policy headlines the docket in European trading hours, but the release might have reduced impact this time around. In their latest policy decision, the ECB opted to keep policy at status quo, but since the “Brexit” decision, the market has seen increasing bets for further policy easing by the central bank. The fact that the meeting was held before the “Brexit” vote might imply that the minutes are unlikely to have an impact on the market’s view.
Taking this into consideration, focus might shift to tomorrow’s all important June US NFP report, and the market may continue to consolidate between levels heading into the main event tomorrow.
EUR/USD 5-Min GSI Chart: July 7, 2016

The EUR/USD has seen another failed breakout attempt today at the 1.11 handle, and currently looks under pressure in early London trading hours; breaking support around 1.1075 (see chart below). Interestingly the GSI indicated that in the past, similar momentum patterns like the one seen at the 1.11 handle saw more downside pressure, while seeing a bounce from 1.1075 before a break below. The GSI indicator calculates the distribution of past event outcomes given certain momentum patterns, and can give you a look at the market in a way that's never been possible before, analyzing millions of historical prices in real time. By matching events in the past, GSI describes how often the price moved in a certain direction.
You can learn more about the GSI here.
EUR/USD Technical Levels:

Click here for the DailyFX Support & Resistance tool
We use volatility measures as a way to better fit our strategy to market conditions. Participants might hold back on strong directional conviction before the NFPs. In turn, this may imply that range bound trading might continue.
EUR/USD 30-Min Chart with SPX 500 Overlay: July 7, 2016

The EUR/USD broke below prior support at 1.1075. Further levels of interest on a move to the downside might be a support area around 1.1035 followed by the 1.10 handle, 1.0970 and 1.0950.
Levels of potential resistance on a move higher may be 1.1075, an area of resistance above the 1.11 big figure, a zone below the 1.1150 level, 1.1160 and 1.1180.
When price reaches those levels, short term traders might use the GSI to view how prices reacted in the past given a certain momentum pattern, and see the distribution of historical outcomes in which the price reversed or continued in the same direction. We generally want to see GSI with the historical patterns significantly shifted in one direction, which could potentially be used with a pre-determined bias as well.
A common way to use GSI is to help you fade tops and bottoms, and trade breakouts. That’s why traders may want to use the GSI indicator when price reaches those specific pre-determined levels, and fit a strategy that can offer a proper way to define risk. We studied over 43 million real trades and found that traders who do that were three times more likely to turn a profit. Read more on the “Traits of Successful Traders” research.
Meanwhile, the DailyFX Speculative Sentiment Index (SSI) is showing that about 38.8% of traders are long the EUR/USD at the time of writing. Retail traders have added to shorts on the move higher, apparently trying to sell the pullback. The current range bound trading environment in the pair seems to be in line with retail traders more successful trading calls (See “Traits of Successful Traders” research). This could potentially imply further weakness ahead for the pair.
You can find more info about the DailyFX SSI indicator here
--- Written by Oded Shimoni, Junior Currency Analyst for DailyFX.com
To contact Oded Shimoni, e-mail oshimoni@dailyfx.com


