


Talking Points:
- AUD/USD broke above key resistance at the 0.75 handle as the Aussie tracked stocks higher
- RBA’s rate decision expected to verify that the central bank is in a “wait-and-see” mode
The AUD/USD has broken above a key resistance level at the 0.75 handle after the pair saw a quick recovery from a drop of approximately 60 pips on the open. The move to the upside appears to have coincided with a push higher in Asian stock prices, which could suggest that the sentiment linked currency managed to see through a yet undecided election in Australia to track stocks higher.
Today is a holiday in the United States, which might imply lower liquidity in the next couple of trading hours, possibly making for more difficult trading conditions. Activity might pick up later as we approach a number of event risk in Asian trade headlined by the RBA’s rate decision, which could potentially see a significant response by the pair.
Taking this into consideration, we look to find short term trading opportunities using the Grid Sight Index (GSI) indicator.
Click Here for the DailyFX Calendar
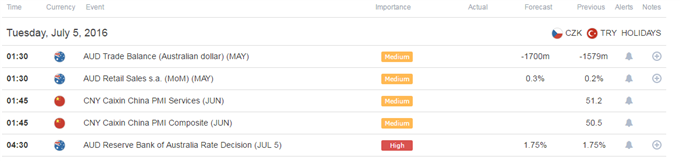
Australia’s Trade Balance is set to hit the wires first at 01:30 GMT. The print is expected to show net export deficit expanded to -1.7b versus a -1.579b prior print, which was the lowest reading since February 2015.
Australia’s Retail Sales is on the docket as well. The seasonally adjusted month-on-month figure is expected to show that store purchases increased in May by 0.3% versus a 0.2% prior print. Higher Retail Sales might suggest inflationary pressures, which could reduce the need by the RBA to further cut rates. In turn, this might potentially be seen as a hint to the upcoming rate decision slightly after.
China Claxin PMIs could have an impact on the pair as well given China and Australia close trading relations. A pickup in activity, which could potentially be derived from the PMI figures, might suggest reduced risk of a downturn in the Chinese economy, thus proving supportive for the Australian Dollar.
With that said, follow through on any significant beat or miss to expectations to these scheduled releases might prove limited this time as participants could potentially hold back before the “main event” slightly after, which is the RBA’s rate decision.
Expectations are leaning quite heavily for the RBA to keep policy at status quo in this meeting, with rates expected to remain at record low 1.75%, signaling that the central bank is in a “wait and see mode”. In turn, this might suggest that if we see a confluence of positive readings in the Australian indicators and the Chinese PMIs, participants might act in anticipation and buy the Australian Dollar. The contrary seems less clear because lower readings might suggest a higher probability for a rate cut, which clashes with the consensus forecast. Making things more complicated could be potential comments on the “Brexit” decision. If the RBA hints at possible responses to pressures on “Brexit” fallouts, this could send the AUD/USD lower. Suffice it to say, a case of a surprise cut seems likely to send the Aussie tumbling.
AUD/USD 5-Min GSI Chart: July 4, 2016

The AUD/USD is trading above the 0.75 handle, which could act as support on a “resistance turned support” basis. If price returns to the level, traders could use the GSI to see how price reacted in the past given a specific momentum pattern. The GSI indicator calculates the distribution of past event outcomes given certain momentum patterns, and can give you a look at the market in a way that's never been possible before, analyzing millions of historical prices in real time. By matching events in the past, GSI describes how often the price moved in a certain direction.
You can learn more about the GSI here.
AUD/USD Technical Levels:

Click here for the DailyFX Support & Resistance tool
We use volatility measures as a way to better fit our strategy to market conditions. Lower levels of liquidity today on the US holiday and a quiet economic calendar could potentially see reduced trading activity in the hours ahead, which could suggest that technical levels may hold, but things might pick up in Asian trading hours. The market is still sensitive to anything “Brexit” related as well. In turn, this may imply that breakout type trades are generally preferable later today.
AUD/USD 30-Min Chart with SPX 500 Overlay: July 4, 2016
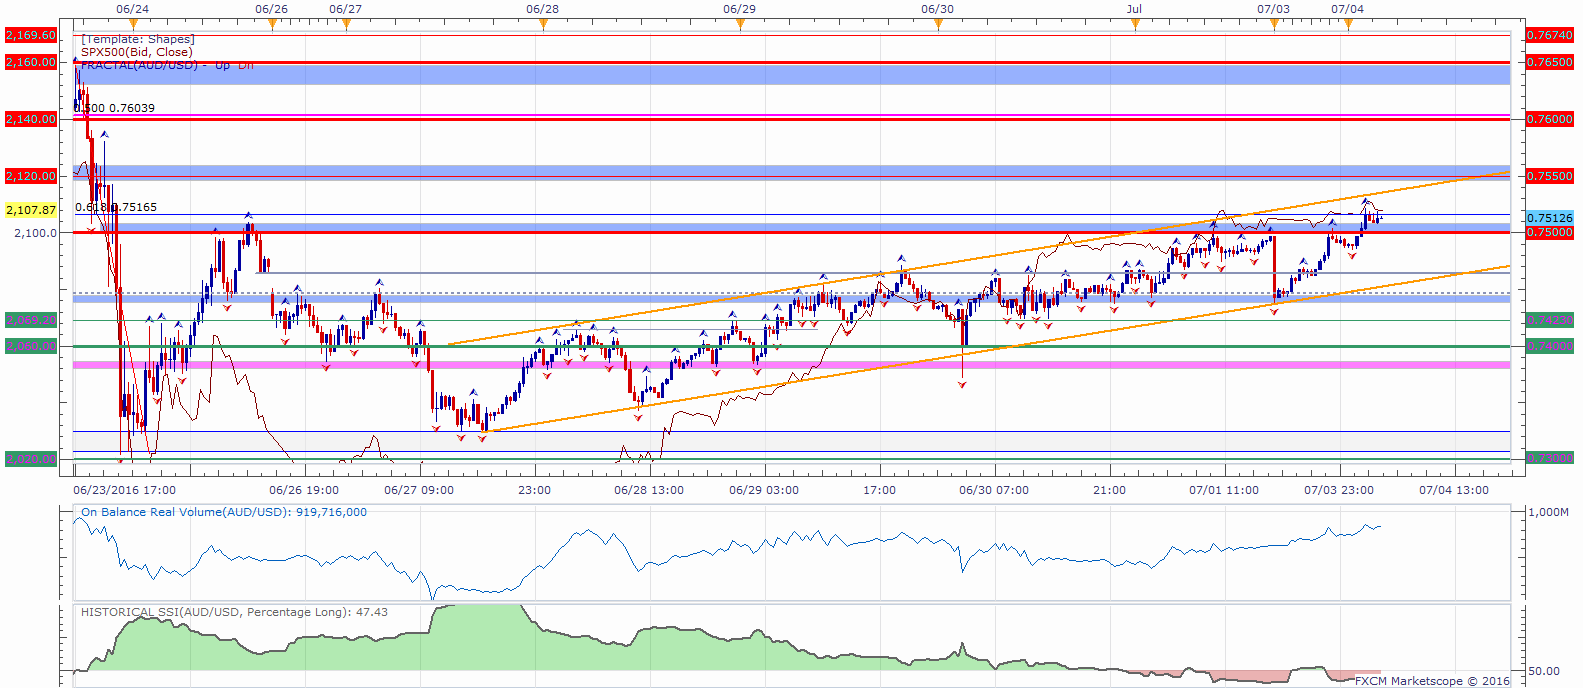
The AUD/USD is trading just below the 0.7516 level, which is the 0.618 Fib of the “Brexit” decline. Initial support might be found at the 0.75 handle followed by 0.7465, and what seems like a key support area around 0.7450 which also coincides with a trend line support. A move below this level might expose the 0.7423 level followed by the 0.74 handle.
Level of interest on a move higher could be a potential resistance area around the 0.7550 level followed by the 0.76 handle, and a resistance zone below the 0.7650 level.
When price reaches those levels, short term traders might use the GSI to view how prices reacted in the past given a certain momentum pattern, and see the distribution of historical outcomes in which the price reversed or continued in the same direction. We generally want to see GSI with the historical patterns significantly shifted in one direction, which could potentially be used with a pre-determined bias as well.
A common way to use GSI is to help you fade tops and bottoms, and trade breakouts. That’s why traders may want to use the GSI indicator when price reaches those specific pre-determined levels, and fit a strategy that can offer a proper way to define risk. We studied over 43 million real trades and found that traders who do that were three times more likely to turn a profit. Read more on the “Traits of Successful Traders” research.
Meanwhile, the DailyFX Speculative Sentiment Index (SSI) is showing that about 47.4% of traders are long the AUD/USD at the time of writing. Retail traders flipped net short during the correction higher, apparently trying to sell the pullback.The SSI is mainly used as a contrarian indicator, implying a further strength ahead for the pair.
You can find more info about the DailyFX SSI indicator here
--- Written by Oded Shimoni, Junior Currency Analyst for DailyFX.com
To contact Oded Shimoni, e-mail oshimoni@dailyfx.com


