


Talking Points:
- AUD/USD trading higher alongside risk assets and the British Pound
- RBA’s June Meeting minutes set to hit the wires in less than 24 hours, but may have limited impact
The AUD/USD is trading higher alongside risk assets and the British Pound at the start of the trading week. The move higher seems to follow a general “risk on” sentiment coming into the week, apparently on the backdrop of polls over the weekend that seemed to favor the “Remain” side in the upcoming EU/ UK referendum.
A quiet economic calendar today puts the spotlight on the upcoming RBA June meeting minutes, which could provide further information on the bank’s rate outlook. With that said, the otherwise major event risk could have limited “market moving” influence this week as focus seems to be put on “Brexit” shifting sentiment.
Taking this into consideration, we look to find short term trading opportunities using the Grid Sight Index (GSI) indicator.
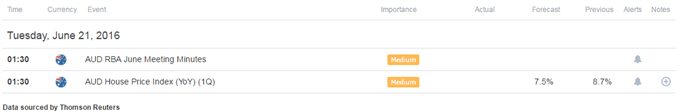
Click Here for the DailyFX Calendar
The RBA June Meeting Minutes is the next upcoming scheduled major event risk on the docket. The Australian Dollar rallied versus its US counterpart following the latest RBA rate decision, in which the central bank opted to keep policy at status quo, clashing with uncertainty about the bank’s rate path on the backdrop of the prior rate cut. The Minutes from the meeting could give further information on whether the RBA has endorsed a prolonged period of a hold or just a temporary pause before further easing.
With that said, the event that probably would have been influential on a “normal” week could have limited impact as the market appears to be completely absorbed by the ebbs and flows of “Brexit” induced sentiment. The sentiment linked Australian Dollar is trading higher at the start of the week alongside the British Pound and “risk assets”, presumably on the backdrop of the latest “Brexit” polls that show an advantage for the “Remain” side. This might potentially put the focus on risk sentiment as the main driver for the AUD/USD at the moment.
AUD/USD 3-Min GSI Chart: June 20, 2016

The AUD/USD edging higher since market open. The GSI indicator above shows that in 50% of similar past events, the pair continued to trade higher by 9 pips and by 17 pips 19% of past events. The GSI indicator calculates the distribution of past event outcomes given certain momentum patterns, and can give you a look at the market in a way that's never been possible before, analyzing millions of historical prices in real time. By matching events in the past, GSI describes how often the price moved in a certain direction.
You can learn more about the GSI here.
AUD/USD Technical Levels:

Click here for the DailyFX Support & Resistance tool
We use volatility measures as a way to better fit our strategy to market conditions. The AUD/USD gapped higher at market open, apparently on ebbing “Brexit” fears. The trading environment at the moment seems to represent heightened possibility for volatile moves and reactions.
In turn, it may imply that breakout type trades are preferable in the short term.
AUD/USD 30-Min Chart With SPX500 Overlay: June 20, 2016
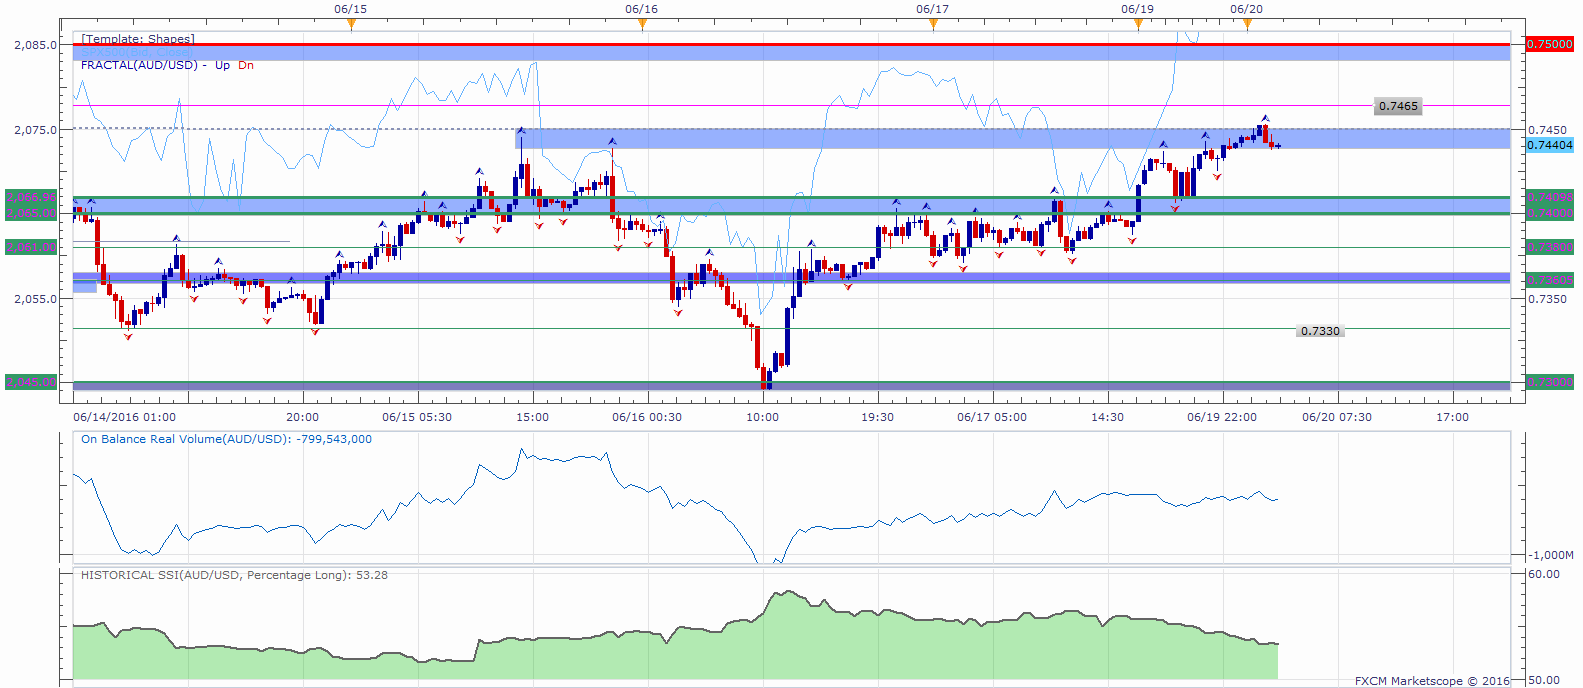
The AUD/USD is trading at a possible resistance zone below 0.7450. Other levels of interest on a move higher might be 0.7465 followed by possible resistance below the 0.75 handle. If the price manages to move above that level, further resistance may be found at 0.7550.
Level of interest on a move lower could be a possible support zone between 0.7410-0.7400, followed by 0.7380, 0.7360 and 0.7330. A prior area of support sits below the 0.73 handle as well.
When price reaches those levels, short term traders might use the GSI to view how prices reacted in the past given a certain momentum pattern, and see the distribution of historical outcomes in which the price reversed or continued in the same direction. We generally want to see GSI with the historical patterns significantly shifted in one direction, which could potentially be used with a pre-determined bias as well.
A common way to use GSI is to help you fade tops and bottoms, and trade breakouts. That’s why traders may want to use the GSI indicator when price reaches those specific pre-determined levels, and fit a strategy that can offer a proper way to define risk. We studied over 43 million real trades and found that traders who do that were three times more likely to turn a profit. Read more on the “Traits of Successful Traders” research.
Meanwhile, the DailyFX Speculative Sentiment Index (SSI) is showing that about 53.3% of traders are long the AUD/USD at the time of writing, reducing the long exposure as the price is moving higher, perhaps taking profits too early (see the “Traits of Successful Traders” research ) The SSI is mainly used as a contrarian indicator, implying a slight short bias for the pair.
You can find more info about the DailyFX SSI indicator here
--- Written by Oded Shimoni, Junior Currency Analyst for DailyFX.com


