


Talking Points:
- NZD/USD currently trades above the 0.70 handle after losing some gains from last week’s rally
- Dairy auction figures, New Zealand GDP and FOMC are in focus ahead for the pair
The NZD/USD currently trades above the 0.70 handle (at the time this report was written) after the pair lost some of last week’s gains that followed from the RBNZ’s rate decision, in which the central bank kept policy at status quo and appeared to signal less likelihood for a rate cut. The pair seems to have found some support following the move lower as we head into a significant 24 hours news flow wise.
The Dairy Auction figures are set to hit the wires first today, but could see reduced impact in anticipation of the more market moving FOMC rate decision, while the New Zealand GDP figures could add or deter further momentum.
Taking this into consideration, we look to find short term trading opportunities using the Grid Sight Index (GSI) indicator.

Click Here for the DailyFX Calendar
The New Zealand Dairy Auction is due to hit the wires around the start of US trading hours. The auction is set to start at 12:00 GMT, but official timing of the release varies, which might imply that traders should proceed with caution at those hours. The last auctions saw the average price rise by 3.4% to $2,329. The dairy industry is New Zealand's biggest export earner, accounting for more than 29% of the country's exports, making this an important indicator to watch as falling dairy prices could potentially put pressure on the RBNZ to further cut rates. With that being said, the Kiwi might not produce a significant reaction this time around versus the US Dollar if market participants hold back before the more market moving FOMC Rate Decision.
The FOMC rate decision is expected to show that the central bank opted to keep the target range for the federal funds rate unchanged at 0.25% to 0.5%, which might indicate that focus could be put on the Fed’s Economic Projections and interest rate forecasts. If the Fed leaves the 2016 outlook unchanged for two rate hikes, this could potentially send the US Dollar higher on a clash with current market pricing of one hike in December (58% probability according to Fed Fund futures).
The New Zealand 1Q’16 GDP figures are likely to be taken in context of the FOMC decision for the NZD/USD. The fact that the figures are set to hit the wires after the initial “digestion” of the FOMC seems likely to indicate that the numbers could add to the pair’s momentum or deter it. The year-on-year 1Q print is expected to show that New Zealand’s economy grew by 2.6% versus a prior 2.3% print.
NZD/USD 5-Min GSI Chart: June 15, 2016

The NZD/USD is edging higher at the time of writing. The GSI indicator above shows that in 56% of similar past events, the pair traded higher by 13 pips, and 22% of the events saw a rise of 35 pips. The GSI indicator calculates the distribution of past event outcomes given certain momentum patterns, and can give you a look at the market in a way that's never been possible before, analyzing millions of historical prices in real time. By matching events in the past, GSI describes how often the price moved in a certain direction.
You can learn more about the GSI here.
NZD/USD Technical Levels:

Click here for the DailyFX Support & Resistance tool
We use volatility measures as a way to better fit our strategy to market conditions. NZD 1-week implied volatility versus the US Dollar currently stands at 12.75 (only surpassed by the British Pound and the Yen).
This fact, combined with the aforementioned event risk, might imply that breakout type trades are preferable in the short term.
NZD/USD 30-Min Chart With SPX 500 Overlay: June 15, 2016
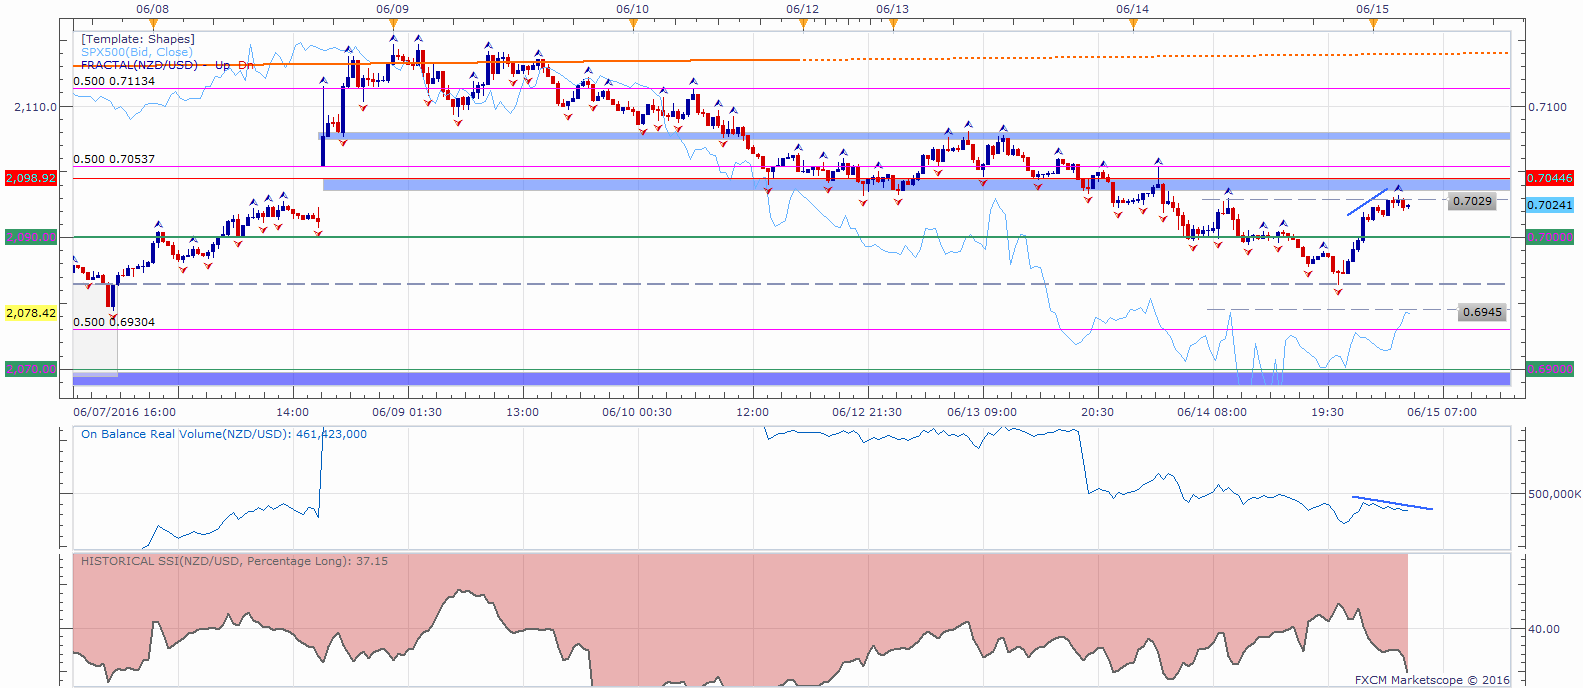
The NZD/USD is near possible resistance at 0.7029, with a potential resistance zone just above at around 0.7040. Other levels on a move higher may be 0.70537, followed by 0.7080, 0.7113 and the confluence of resistance around the June 9 high and a long term rising trend line at about 0.7145. Given the possible volatility from today’s events, the 0.7170 level might provide a significant resistance should we see an outsized move today (not seen in the chart above).
Levels of interest on a move lower could be the 0.70 handle for possible support, followed by 0.6964 and 0.6945, while the 0.6930 level might provide support as well before a major support zone below the 0.69 handle.
When price reaches those levels, short term traders might use the GSI to view how prices reacted in the past given a certain momentum pattern, and see the distribution of historical outcomes in which the price reversed or continued in the same direction. We generally want to see GSI with the historical patterns significantly shifted in one direction, which could potentially be used with a pre-determined bias as well.
A common way to use GSI is to help you fade tops and bottoms, and trade breakouts. That’s why traders may want to use the GSI indicator when price reaches those specific pre-determined levels, and fit a strategy that can offer a proper way to define risk. We studied over 43 million real trades and found that traders who do that were three times more likely to turn a profit. Read more on the “Traits of Successful Traders” research.
Meanwhile, the DailyFX Speculative Sentiment Index (SSI) is showing that about 37.15% of traders are long the NZD/USD at the time of writing. The SSI is mainly used as a contrarian indicator, implying possible strength ahead.
You can find more info about the DailyFX SSI indicator here
--- Written by Oded Shimoni, Junior Currency Analyst for DailyFX.com


