


Talking Points:
- USD/JPY currently trades near the 106.00 handle after breaking down in Asian trade
- A quiet Monday news flow wise stands in sharp contrast to a week full of key event risk
The USD/JPY currently trades below the 106.00 handle (at the time this report was written) after the pair broke down in Asia trading hours. The move lower appeared to be on the backdrop of a general “risk off” environment following a sharp move lower on Wall Street this past Friday.
A quiet Monday news flow wise stands in sharp contrast to the rest of the week, which includes rate decisions by major central banks, with the FOMC and BoJ in focus for the pair.
Taking this into consideration, we look to find short term trading opportunities using the Grid Sight Index (GSI) indicator.

Click Here for the DailyFX Calendar
The quiet economic calendar today might indicate that focus will be put on risk trends and possibly pre-positioning for key event risk later this week. Indeed, the “anti-risk” Yen status appears to have helped the currency break below the 106.00 handle versus the US Dollar earlier, and rate decisions by the central banks could induce more volatility for the pair. With that said, other event risks, such as the possibility for a “Brexit”, and their affect on risk trends might have amplified implications for the pair while divergent monetary policies appear to play a more complicated role than in the past years.
USD/JPY 5-Min GSI Chart: June 13, 2016

The USD/JPY is testing the big 106.00 level at the time of writing. We can see that the GSI indicator shows that the pair continued higher by 12 pips in 50% of similar past events (as opposed to 21% moves lower by 14 pips). If this is the case again, the pair might attempt to break above and hold the 106.00 level. The GSI indicator calculates the distribution of past event outcomes given certain momentum patterns, and can give you a look at the market in a way that's never been possible before, analyzing millions of historical prices in real time. By matching events in the past, GSI describes how often the price moved in a certain direction.
You can learn more about the GSI here.
USD/JPY Technical Levels:

Click here for the DailyFX Support & Resistance tool
We use volatility measures as a way to better fit our strategy to market conditions. The USD/JPY could see heightened volatility this coming days on major event risks with FOMC and BoJ interest rate decisions down the line. This could imply that breakout type trades are preferable in the short term, as the market may see swings on pre-positioning and large movements in risk assets.
USD/JPY 30-Min Chart: June 13, 2016
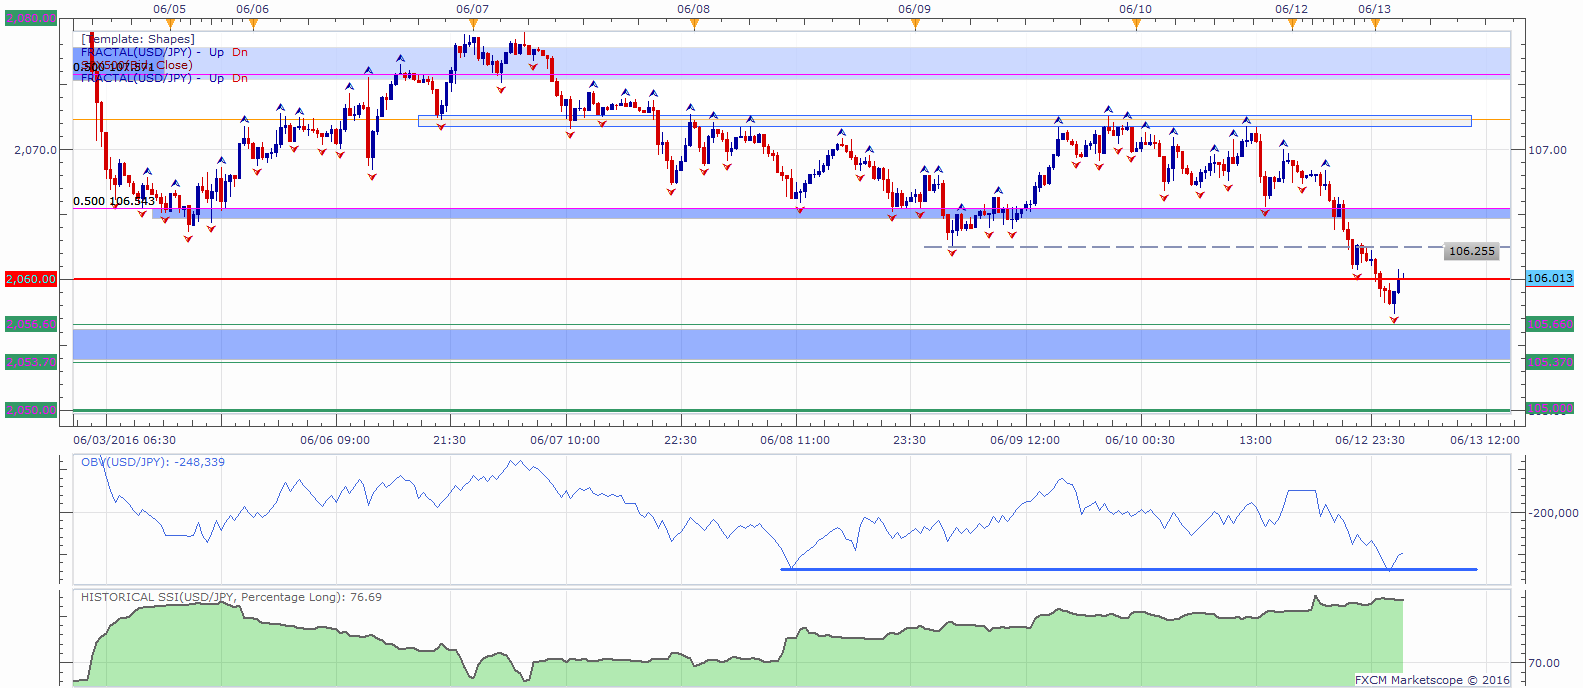
The USD/JPY is testing the 106.00 level after breaking lower earlier today.
If the pair manages to hold below the level, this might expose a possible support zone between 105.66 to 105.37, with the 105.00 handle lower.
Levels of interest on a move higher may be 106.255 followed by a resistance zone at about 106.50 and another zone at around 107.20.
When price reaches those levels, short term traders might use the GSI to view how prices reacted in the past given a certain momentum pattern, and see the distribution of historical outcomes in which the price reversed or continued in the same direction.
A common way to use GSI is to help you fade tops and bottoms, and trade breakouts. That’s why traders may want to use the GSI indicator when price reaches those specific pre-determined levels, and fit a strategy that might offer a proper way to define risk.
Meanwhile, the DailyFX Speculative Sentiment Index (SSI) is showing that about 76.6% of traders are long the USD/JPY at the time of writing, suggesting that traders might be trying to pick a bottom in the pair. The SSI is mainly used as a contrarian indicator, implying further weakness ahead.
You can find more info about the DailyFX SSI indicator here
--- Written by Oded Shimoni, Junior Currency Analyst for DailyFX.com


