


What’s inside:
- Strong trend higher continues post-FOMC
- Market extended, looking for a pullback short-term
- Still room to the upside, however, before finding significant resistance
Strong push post-FOMC, market becomes extended
Another strong outing yesterday after Wednesday’s dovish FOMC meeting. We won’t discuss what the outcome of the meeting could mean from a macro-standpoint, but rather do our usual and focus on the technical aspects of the market. Yesterday made it five days up in a row for the Dow. The S&P 500 and Dow, since breaking above signficant resistance, have become short-term extended and vulnerable to a set-back. The Nasdaq which looked poised to take over as the leade r a week ago or so failed to do such and continues to be the laggard of the bunch.
What do we do now?
There may be some room here for the scalper from the short-side given the extended nature of the market, but I wouldn't overstay my welcome on declines. The broader expectation is for any pullback/consolidation which unfolds to be relatively shallow and short-lived until the indices reach significant levels of resistance. If sellers step in here with some vigor then we could test the top of the S&P 500 support zone between 1990/2010, but likely only the upper portion of that region. The trend higher is unlikely to suddenly fall apart without first providing warning signs, of which none are yet readily visible.
As we discussed the other day the general preference for trading this market is to buy dips over chasing momentum. While the momentum approach may have worked a bit recently when trading the Dow, over time it isn't a great policy for trading indices.
Broader daily targets (resistance)
Daily resistance in the S&P 500 comes in by way of a top-side trend-line near 2060 at this time, with an even bigger target not until the zone between 2080 and 2100. The Dow is closing in on a fairly significant trend-line running off the May 2015 record high, and above there a zone of price congestion which will almost certainly take a mighty push to overcome. The first area of resistance comes just shy of 17700 (trend-line) with the congestion zone extending up towards 18000. The Nasdaq 100 is stilling struggling to get back to its version of S&P 500 – 1990/2010; it will need to get to 4450/4500 to accomplish this. (200-day = 4419, it touched yesterday)
S&P 500 Daily: Aug '15 - Present

Dow Daily: May '15 - Present
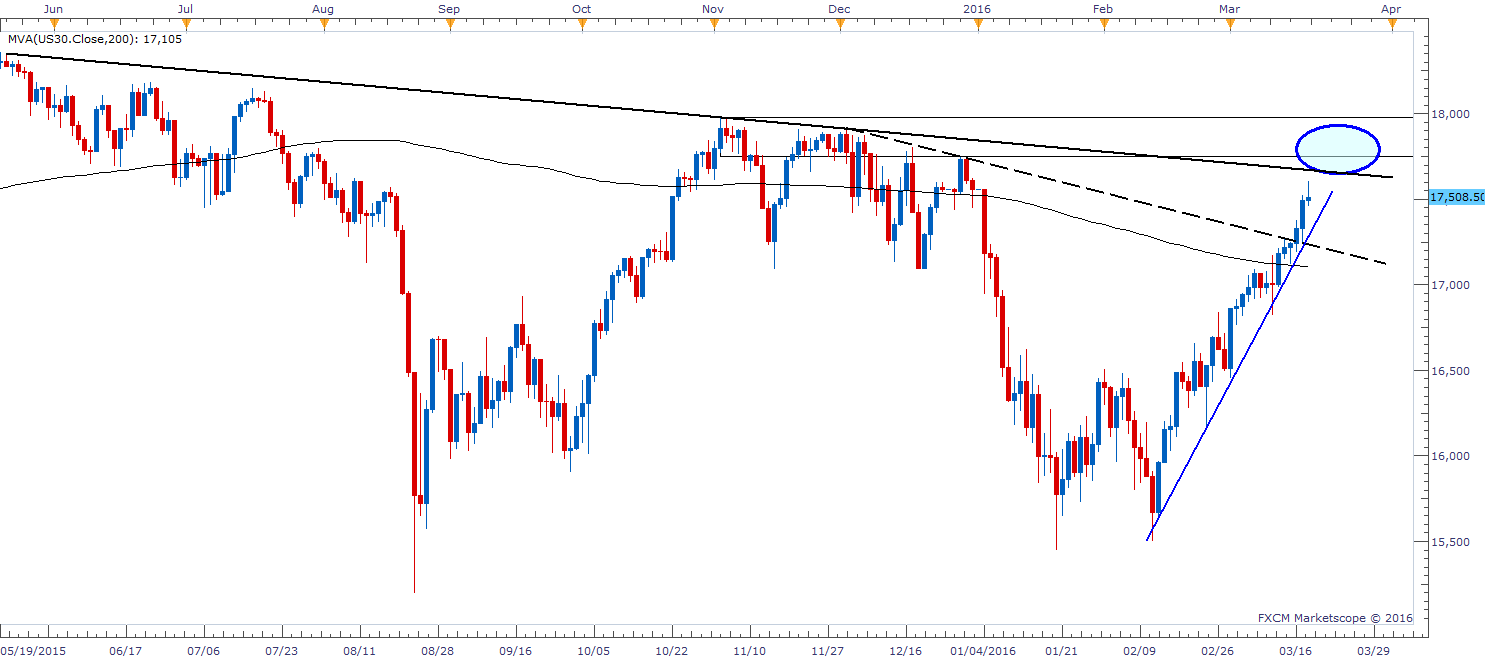
A lot can happen between now and then
As expressed before the market is in an extended state, especially the Dow, which had risen roughly 700 points from the ECB-day low to yesterday’s high with only very short-lived, intra-day pullbacks. The fact the rise has been sharp, in of itself, doesn’t mean the indices will pull back, but probability has climbed that this will be the case. If a decline ensues does so in a constructive manner, as they have recently, we will look to reload for another shot higher towards the bigger scope of resistance levels. (Note: Watch how the Nasdaq fares during a pullback, because its relative weakness right now suggests it should decline with more ease than the other indices. If it doesn’t lead a decline lower, and holds up better than the other indices then we may see the rotation into the Nasdaq 100 discussed the other day.)
Check out this guide, "Traits of Successful Traders", and see what strengths you possess, and find out which ones you need to work on.
---Written by Paul Robinson, Market Analyst
You can follow Paul on Twitter @PaulRobinsonFX, or email him directly at instructor@dailyfx.com


