


Talking Points:
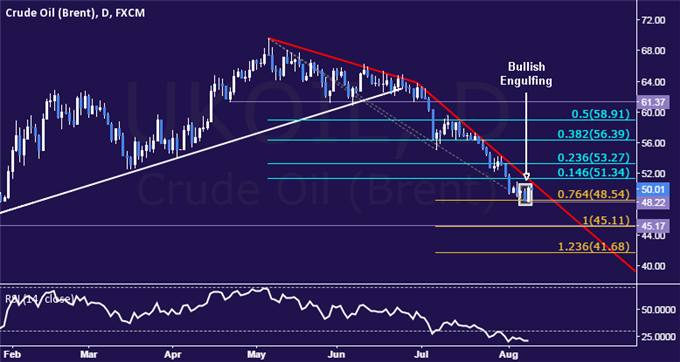
- Support: 48.22, 45.11, 41.68
- Resistance: 51.34, 53.27, 56.39
- Visit our crude oil page for more
Crude oil prices put in a Bullish Engulfing candlestick pattern, hinting a move higher may be brewing ahead. A daily close above 51.34 (14.6% Fibonacci retracement, trend line) exposes the 23.6% level at 53.27. Alternatively, a move below the 48.22-54 area (76.4% Fib expansion, August 10 low) opens the door for a test of the 45.11-17 zone (100% expansion, January 13 low).
KEY UPCOMING EVENT RISK:
12 AUG 2015, 05:30 GMT – China Retail Sales (YoY) (JUL) – Expected: 10.6%, Prev: 10.6%
12 AUG 2015, 05:30 GMT – China Industrial Prod. (YoY) (JUL) – Expected: 6.6%, Prev: 6.8%
12 AUG 2015, 14:30 GMT – US DOE Crude Oil Inventories – Expected: n/a, Prev: -4407K
13 AUG 2015, 12:30 GMT – US Retail Sales (MoM) (JUL) – Expected: 0.6%, Prev: -0.3%
14 AUG 2015, 12:30 GMT – US PPI (YoY) (JUL) – Expected: -0.9%, Prev: -0.7%
14 AUG 2015, 17:00 GMT – UofM US Consumer Conf. (AUG P) – Expected: 93.6, Prev: 93.1
--- Written by Ilya Spivak, Currency Strategist for DailyFX.com
To receive Ilya's analysis directly via email, please SIGN UP HERE
Contact and follow Ilya on Twitter: @IlyaSpivak


