


Talking Points:
- US Dollar Revisits Weekly High, Hints at Further Gains Ahead
- S&P 500 Attempts Recovery After Snapping 3-Month Uptrend
- Crude Oil Setup Warns of Losses, Gold Breaks Range Support
Can’t access the Dow Jones FXCM US Dollar Index? Try the USD basket on Mirror Trader. **
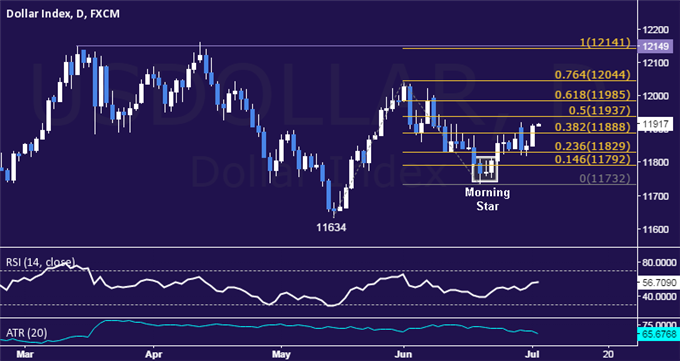
US DOLLAR TECHNICAL ANALYSIS – Prices advanced as expected after prices put in a bullish Morning Star candlestick pattern. Near-term resistance is at 11937, the 50% Fibonacci expansion, with a break above that on a daily closing basis exposing the 61.8% level at 11985. Alternatively, a move below the 38.2% Fib at 11888 opens the door for a challenge of the 23.6% level at 11829.
** The Dow Jones FXCM US Dollar Index and the Mirror Trader USD basket are not the same product.
S&P 500 TECHNICAL ANALYSIS – Prices are attempting to correct higher having turned downward as expected. From here, a move above the 38.2% Fibonacci retracement at 2083.60exposes the 50% level at 2092.40. Alternatively, a move below the 23.6% Fib at 2072.70 targets the 14.6% retracement at 2066.00.

GOLD TECHNICAL ANALYSIS – Prices edged through range support, ending a period of consolidation and seemingly opening the door for deeper losses ahead. A move below the 61.8% Fibonacci expansion at 1162.64 exposes the 76.4% level at 1152.47. Alternatively, a move above the 50% Fib at 1170.86 targets the 38.2% expansion at 1179.07.

CRUDE OIL TECHNICAL ANALYSIS – Prices cleared rising trend line set from mid-January, hinting the down trend from the second half of 2014 may be resuming. A move below the 60.27-61.37 area (38.2% Fibonacci retracement, April 22 low) exposes the 50% level at 57.39. Alternatively, a turn back above the trend line – now at 63.84 – targets the 23.6% Fib expansion at 66.69.

--- Written by Ilya Spivak, Currency Strategist for DailyFX.com
To receive Ilya's analysis directly via email, please SIGN UP HERE
Contact and follow Ilya on Twitter: @IlyaSpivak


