


Talking Points:
- US Dollar Jumps Higher from Monthly LowSupport
- S&P 500 Attempts to Resume Six-Week Rising Trend
- Gold Accelerates Lower, Crude Oil Digesting Losses
Can’t access the Dow Jones FXCM US Dollar Index? Try the USD basket on Mirror Trader. **
US DOLLAR TECHNICAL ANALYSIS – Prices are attempting to rebuild upside momentum after correcting downward as expected. Near-term resistance is at 12066, the 14.6% Fibonacci expansion, with a break above that on a daily closing basis exposing the 12149-77 zone (23.6% level, March 13 high). Alternatively, a reversal below the 11858-86 area (23.6% Fib retracement, March 18 low)clears the way for a test of the 38.2% threshold at 11679.
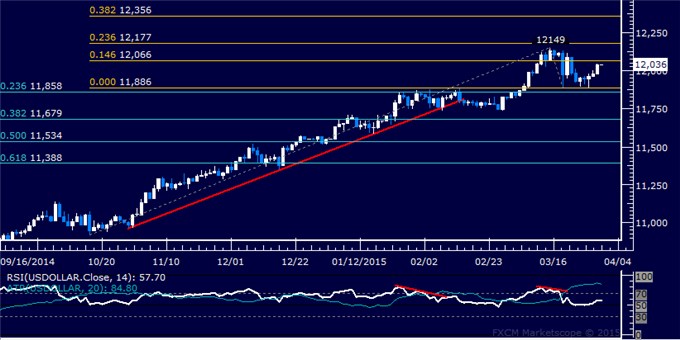
Daily Chart - Created Using FXCM Marketscope
** The Dow Jones FXCM US Dollar Index and the Mirror Trader USD basket are not the same product.
S&P 500 TECHNICAL ANALYSIS – Prices are attempting to rebuild upside momentum after falling as expected following the appearance of a bearish Evening Star candlestick pattern. A daily close above the 14.6% Fibonacci expansion at 2084.00 exposes the 2111.00-19.40 area (23.6% level, February 25 high). Alternatively, a move belowchannel floor support at 2062.60 targets the March 12 low at 2040.10.
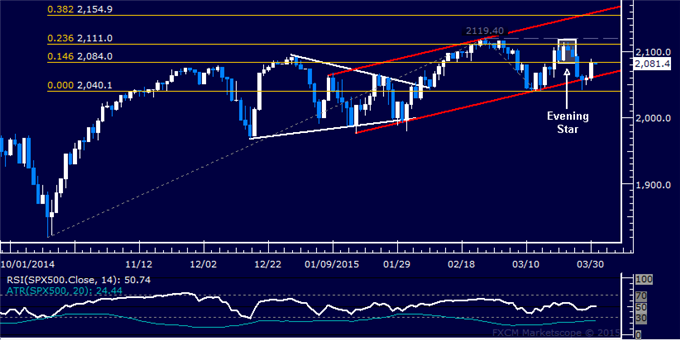
Daily Chart - Created Using FXCM Marketscope
GOLD TECHNICAL ANALYSIS – Prices moved lower as expected after putting in a bearish Dark Cloud Cover candlestick pattern. A daily close below the 23.6% Fibonacci expansion at 1180.90 exposes the 38.2% level at 1156.83. Alternatively, a reversal above the 14.6% expansion at 1195.74 targets the 38.2% Fib retracement at 1205.58.
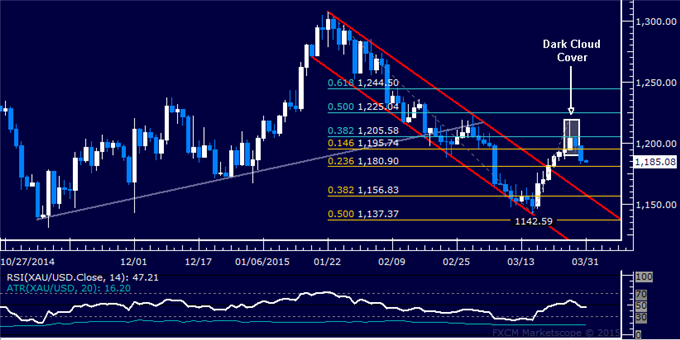
Daily Chart - Created Using FXCM Marketscope
CRUDE OIL TECHNICAL ANALYSIS – Prices reversed sharply lower after finding resistance below the $60/barrel figure. A break below the 38.2% Fibonacci expansion at 55.77 exposes the 50% level at 54.53. Alternatively, a reversal above the March 26 high at 59.75 targets the February 17 high at 62.98.
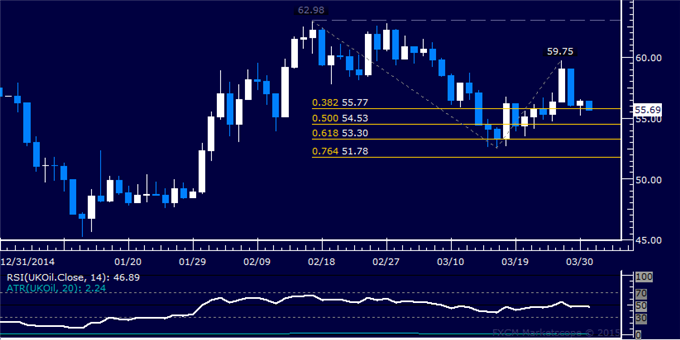
Daily Chart - Created Using FXCM Marketscope
--- Written by Ilya Spivak, Currency Strategist for DailyFX.com
To receive Ilya's analysis directly via email, please SIGN UP HERE
Contact and follow Ilya on Twitter: @IlyaSpivak


