


Talking Points:
- US Dollar Falls Short of Piercing Monthly Range Top
- S&P 500 in Digestion Mode After Setting Record High
- Crude Oil Stalls Below $63, Gold Holds Up at $1200
Can’t access the Dow Jones FXCM US Dollar Index? Try the USD basket on Mirror Trader. **
US DOLLAR TECHNICAL ANALYSIS – Prices issued its largest advance in a month but prices failed to overcome range resistance to secure a breakout. Near-term resistance is in the 11854-76 area (14.6% Fibonacci expansion, March 2009 high), with a break above that on a daily closing basis exposing the 23.6% level at 11963. Alternatively, a below the 14.6% Fib retracementat 11740 opens the door for a challenge of the 23.6% threshold at 11653.
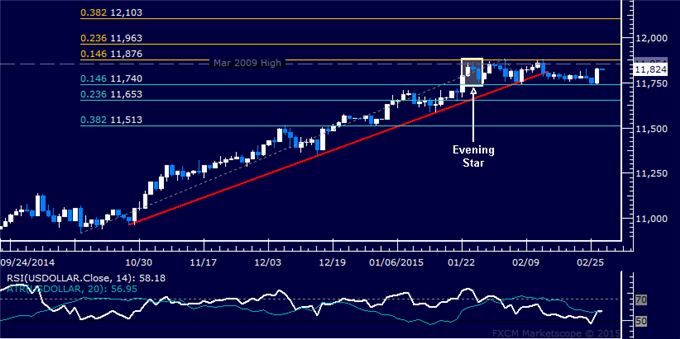
Daily Chart - Created Using FXCM Marketscope
** The Dow Jones FXCM US Dollar Index and the Mirror Trader USD basket are not the same product.
S&P 500 TECHNICAL ANALYSIS – Prices paused to digest gains after advancing to yet another record high. A daily close above the 14.6% Fibonacci expansion at 2121.80 exposes the 23.6% level at 2133.70. Near-term support is at 2102.60, the February 23 low.
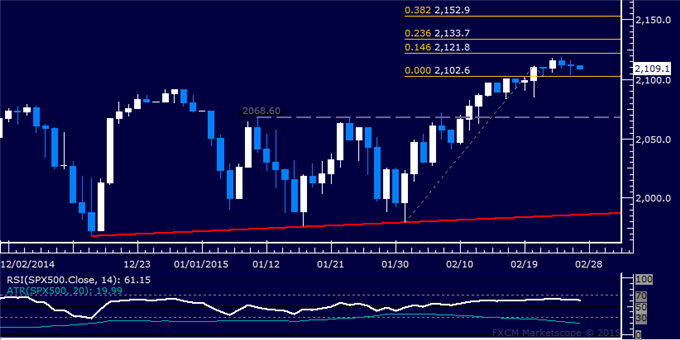
Daily Chart - Created Using FXCM Marketscope
GOLD TECHNICAL ANALYSIS – Prices has stalled above interim support at 1197.86, the 61.8% Fibonacci retracement. A break above the intersection of trend line support-turned-resistance and the 50% level at 1218.80 exposes the 38.2% Fib at 1239.73. Alternatively, a turn below 1197.86 targets the 76.4% retracement at 1171.96.
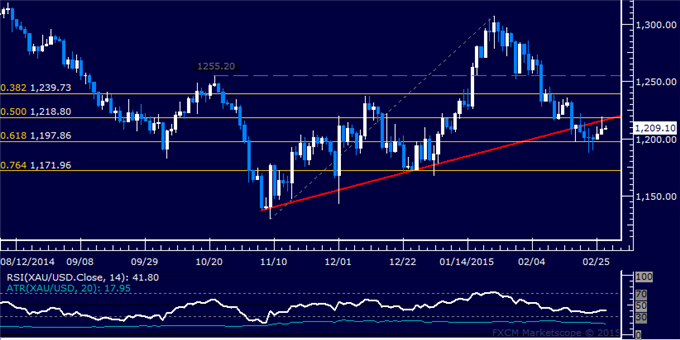
Daily Chart - Created Using FXCM Marketscope
CRUDE OIL TECHNICAL ANALYSIS – Prices launched a recovery as expected, with buyers now attempting to reclaim momentum after a brief pullback. A break above the 23.6% Fibonacci expansion at 61.98 exposes the February 17 high at 62.98, followed by the 38.2% level at 64.58. Alternatively, a reversal below the 14.6% Fib at 60.38 targets resistance-turned-support at 58.17.
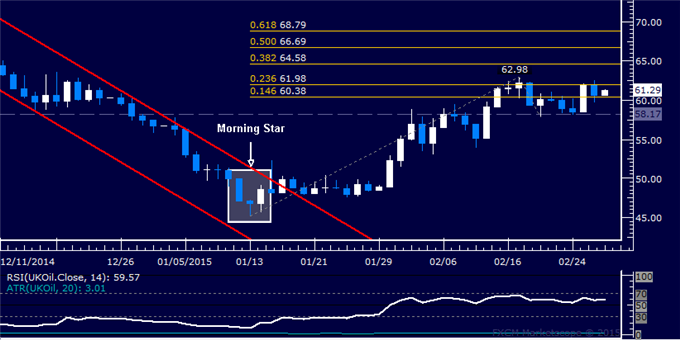
Daily Chart - Created Using FXCM Marketscope
--- Written by Ilya Spivak, Currency Strategist for DailyFX.com
To receive Ilya's analysis directly via email, please SIGN UP HERE
Contact and follow Ilya on Twitter: @IlyaSpivak


