


Talking Points:
- US Dollar Digesting Losses, Eyeing Key Range Support
- S&P 500 Sets Record High, Poised to Continue Upward
- Gold Prices Threaten to Overturn 3-Month Rising Trend
Can’t access the Dow Jones FXCM US Dollar Index? Try the USD basket on Mirror Trader. **
US DOLLAR TECHNICAL ANALYSIS – Prices look to have reversed downward as expected after putting in a bearish Evening Star candlestick pattern. A daily close below the 14.6% Fibonacci retracementat 11740 exposes the 23.6% level at 11653. Alternatively, a turn above the 11854-76 zone (14.6% Fib expansion, March 2009 high) clears the way for a test of the 23.6% expansion at 11963.
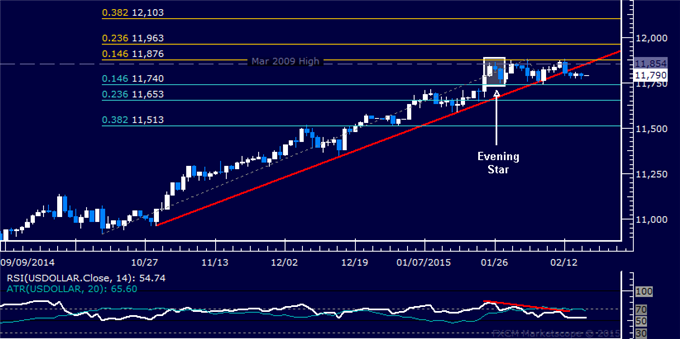
Daily Chart - Created Using FXCM Marketscope
** The Dow Jones FXCM US Dollar Index and the Mirror Trader USD basket are not the same product.
S&P 500 TECHNICAL ANALYSIS – Prices appear poised to continue upward after setting another record high. A break above the 76.4% Fibonacci expansion at 2112.20 exposes the 100% level at 2134.10. Alternatively, a reversal below the 61.8% Fib at 2098.60 targets the 50% expansion at 2087.60.
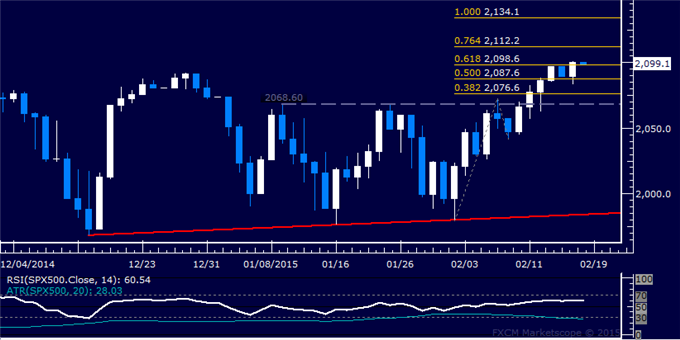
Daily Chart - Created Using FXCM Marketscope
GOLD TECHNICAL ANALYSIS – Prices are set to challenge pivotal support at 1197.86, marked by the intersection of a channel floor, a rising trend line and the 61.8% Fibonacci retracement. A break below this barrier exposes the 76.4% level at 1171.96. Alternatively, a reversal above the 50% level at 1218.80 aims for the 1236.17-39.73 area (38.2% Fib, channel top).
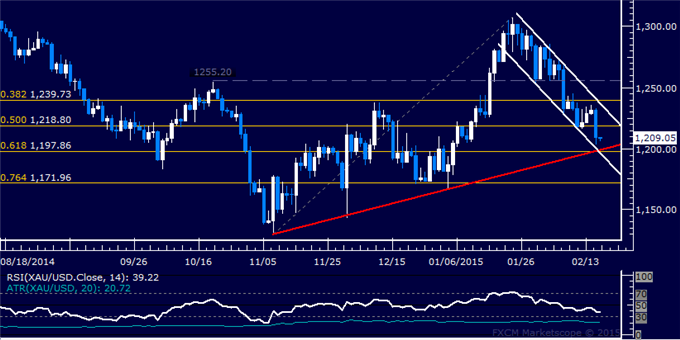
Daily Chart - Created Using FXCM Marketscope
CRUDE OIL TECHNICAL ANALYSIS – Prices continue to push higher after reversing upward as expected, with a break above the 50% Fibonacci retracement at 63.38 exposing the 61.8% level at 67.68. A reversal back below the 38.2% Fib at 59.08 aims for the 23.6% retracement at 53.77.
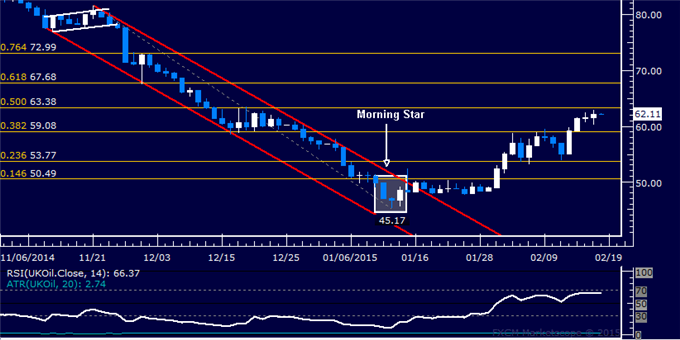
Daily Chart - Created Using FXCM Marketscope
--- Written by Ilya Spivak, Currency Strategist for DailyFX.com
To receive Ilya's analysis directly via email, please SIGN UP HERE
Contact and follow Ilya on Twitter: @IlyaSpivak


