


Talking Points:
- US Dollar Still Waiting to Follow-Through on Reversal Signal
- S&P 500 Struggling to Extend Reversal Below December Low
- Crude Oil Bounce Falters Above $50 Figure, Gold Prices Stall
Can’t access the Dow Jones FXCM US Dollar Index? Try the USD basket on Mirror Trader. **
US DOLLAR TECHNICAL ANALYSIS – Prices may be carving out a top after prices put in a bearish Evening Star candle pattern. Near-term support is at 11599, the 14.6% Fibonacci retracement, with a break below that on a daily closing basis exposing the 23.6% level at 11527. Alternatively, a turn above the 23.6% Fib expansion at 11699 clears the way for a test of the 38.2% threshold at 11796.
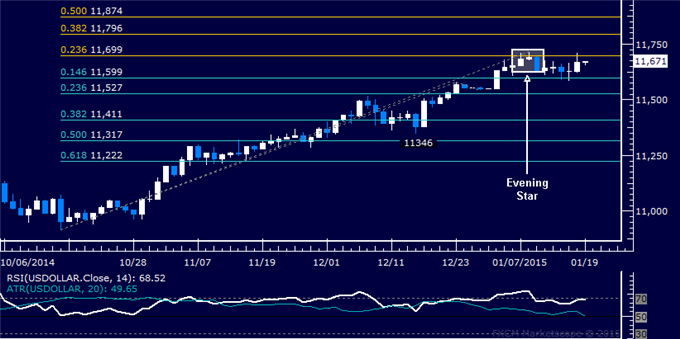
Daily Chart - Created Using FXCM Marketscope
** The Dow Jones FXCM US Dollar Index and the Mirror Trader USD basket are not the same product.
S&P 500 TECHNICAL ANALYSIS – Prices declined as expected after putting in a bearish Evening Star candlestick pattern. A daily close below the 38.2% Fibonacci retracement at 1988.00 exposes the 50% level at 1955.80. Alternatively, a turn back above the 23.6% Fib at 2028.00 aims for the January 9 high at 2068.60.
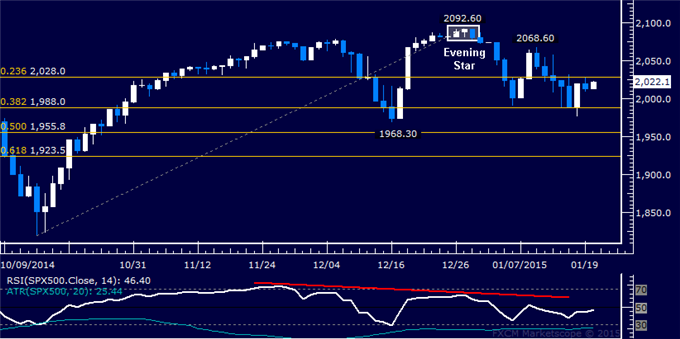
Daily Chart - Created Using FXCM Marketscope
GOLD TECHNICAL ANALYSIS – Prices appear poised to continue higher after rising to the strongest level in over four months. A daily close above the 123.6% Fibonacci expansion at 1300.39 exposes the 138.2% level at 1316.16. Alternatively, a turn back below the 100% Fib at 1274.89 targets the 1249.39-55.20 area marked by the 76.4% expansion and the October 21 high.
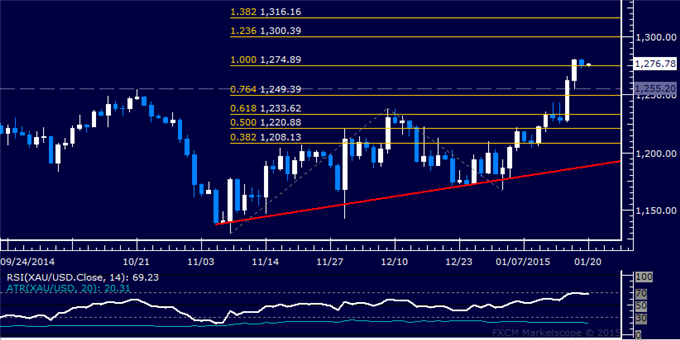
Daily Chart - Created Using FXCM Marketscope
CRUDE OIL TECHNICAL ANALYSIS – Prices are attempting to recover as expected. A daily close above the 14.6% Fibonacci retracement at 50.49 exposes the 23.6% level at 53.77. Alternatively, a reversal below channel top resistance-turned-support at 47.45 targets the January 13 low at 45.17.
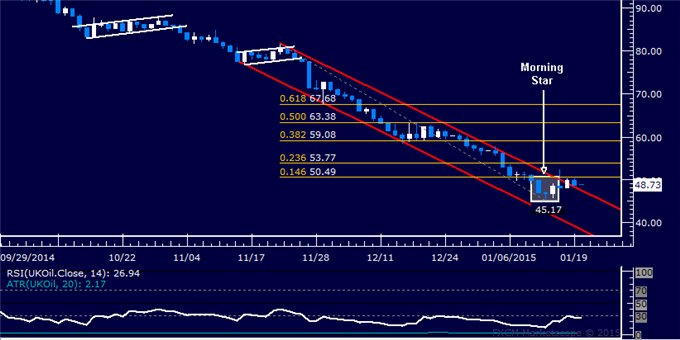
Daily Chart - Created Using FXCM Marketscope
--- Written by Ilya Spivak, Currency Strategist for DailyFX.com
To receive Ilya's analysis directly via email, please SIGN UP HERE
Contact and follow Ilya on Twitter: @IlyaSpivak


