


Talking Points:
- US Dollar Rally Continues as Prices Set Another 5-Year High
- SPX 500 Tries to Launch Recovery After Selloff Stalls Sub-2000
- Gold Snaps 3-Day Win Streak, Crude Oil Finds Support at $50
Can’t access the Dow Jones FXCM US Dollar Index? Try the USD basket on Mirror Trader. **
US DOLLAR TECHNICAL ANALYSIS – Prices continued to push higher for a fourth consecutive day, setting yet another five-year high. Near-term resistance is at 11719, the 61.8% Fibonacci expansion, with a break above that on a daily closing basis exposing the 76.4% level at 11807. Alternatively, a turn below the 50% Fib at 11648 clears the way for a test of the 38.2% expansion at 11577.
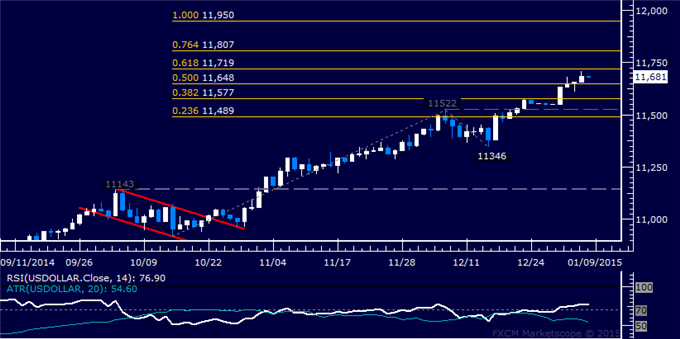
Daily Chart - Created Using FXCM Marketscope
** The Dow Jones FXCM US Dollar Index and the Mirror Trader USD basket are not the same product.
S&P 500 TECHNICAL ANALYSIS – Prices declined as expected after producing a bearish Evening Star candlestick pattern. An attempted rebound sees the index testing above the 23.6% Fibonacci expansion at 2028.00, with confirmation of a break on a daily closing basis exposing the 14.6% level at 2052.60. Alternatively, a reversal below the 38.2% Fib at 1988.00 targets the 1955.80-68.30 area marked by the 50% retracement and the December 16 low.
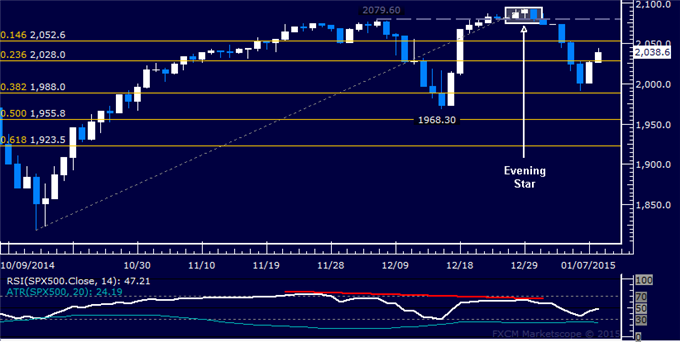
Daily Chart - Created Using FXCM Marketscope
GOLD TECHNICAL ANALYSIS – Prices snapped a three-day winning streak, falling short of retesting December’s swing high. A break back below the 38.2% Fibonacci expansion at 1208.13 aims for rising trend line support at 1180.83. Alternatively, bullish resumption that takes prices through the 50% level at 1220.88 targets the 61.8% Fib at 1233.62.
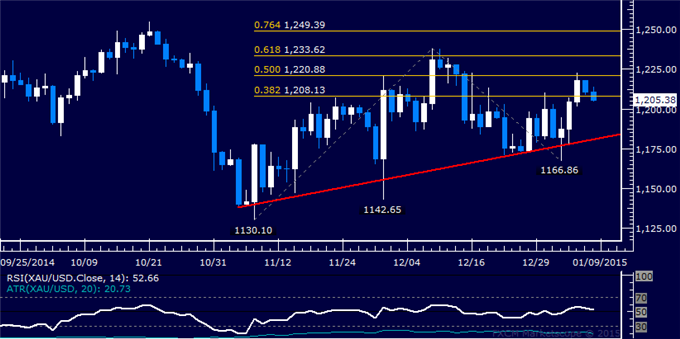
Daily Chart - Created Using FXCM Marketscope
CRUDE OIL TECHNICAL ANALYSIS – Prices found support at the psychologically significant $50/barrel figure, a barrier reinforced by the 61.8% Fibonacci expansion at 49.37. A break below that on a daily closing basis exposes the 76.4% level at 46.00. Alternatively, a turn above the 50% Fib at 52.10 targets the 38.2% expansion at 54.20.
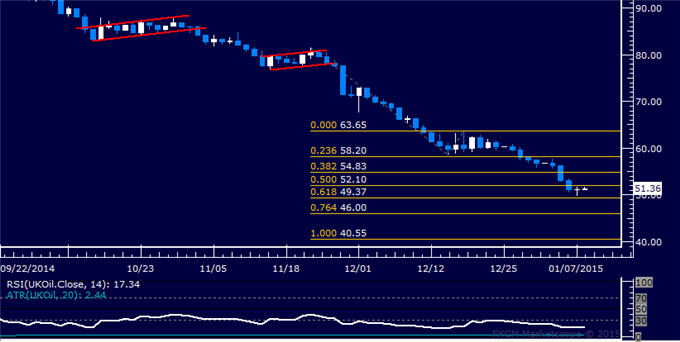
Daily Chart - Created Using FXCM Marketscope
--- Written by Ilya Spivak, Currency Strategist for DailyFX.com
To receive Ilya's analysis directly via email, please SIGN UP HERE
Contact and follow Ilya on Twitter: @IlyaSpivak


