


EUR/USD Price, Chart, and Analysis
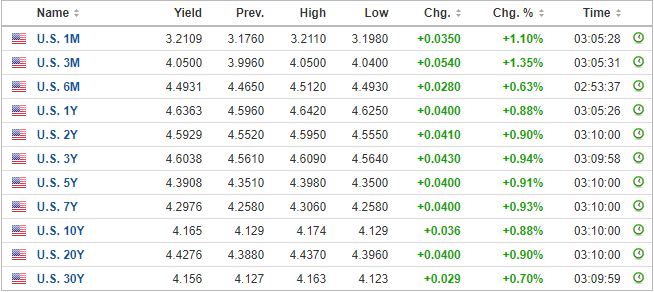
- US Treasury yields continue to print multi-year highs.
- ECB looks set to hike rates by 75bps next week.

The inflation-fighting narrative is back with US Treasury yields moving ever higher. The closely followed 2- and 10-year USTs now yield 4.59% and 4.165%, the highest level seen in around 15 years. Recent comments from Fed officials confirm that the US central bank will hike rates higher and for longer if necessary in the ongoing fight against rampant price pressures in the US. Four Fed officials, Harker, Jefferson, Cook, and Bowman speak later in the session and will likely double down on recent Fed rhetoric.
For all market-moving economic releases and events, see the DailyFX Calendar
The latest CME Fedwatch tool shows a 92.3% of a 75 basis point rate hike at the November 2 FOMC meeting, and an 80% chance of a further 75bp hike at the December 14 meeting. This would leave the Fed target rate at 4.50% - 4.75% at the end of the year.
Next week the European Central Bank (ECB) will announce its latest policy decision and they are likely to hike rates by 75 basis points. Europe’s battle with near double-digit headline inflation continues and the ECB is set to hike rates further over the coming months, giving the single currency a modicum of support.
Trade Smarter - Sign up for the DailyFX Newsletter
Receive timely and compelling market commentary from the DailyFX team
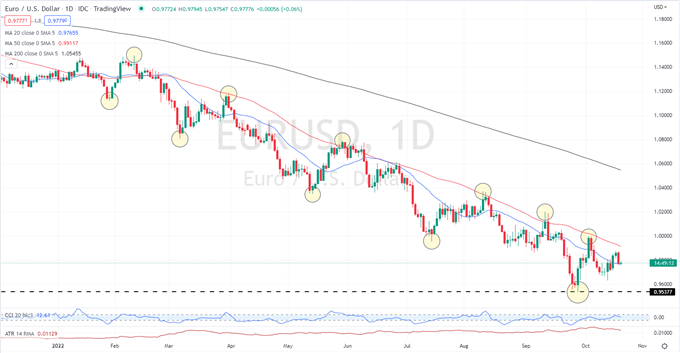
The daily EUR/USD chart shows how the pair have moved consistently lower, creating an unbroken series of lower highs and lower lows, a well-respected bearish technical setup. The last lower low is situated around 0.9537 and is likely to come under pressure, especially if US bond yields continue to climb. Ahead of this level, the October 13 low print at 0.9632 will act as a short-term level of support. Resistance lies at 0.9880 and then parity and the latter looks like it will be difficult to break.
EUR/USD Daily Price Chart October 20, 2022
Retail trader data show that 59.27% of traders are net-long with the ratio of traders long to short at 1.46 to 1. The number of traders net-long is 13.92% higher than yesterday and 2.06% lower from last week, while the number of traders net-short is 13.58% lower than yesterday and 9.01% higher from last week.
We typically take a contrarian view to crowd sentiment, and the fact traders are net-long suggests EUR/USD prices may continue to fall. Positioning is more net-long than yesterday but less net-long from last week. The combination of current sentiment and recent changes gives us a further mixed EUR/USD trading bias.
| Change in | Longs | Shorts | OI |
| Daily | -1% | -4% | -3% |
| Weekly | 4% | -10% | -5% |
What is your view on the EURO – bullish or bearish?? You can let us know via the form at the end of this piece or you can contact the author via Twitter @nickcawley1.


