


DAX 40, FTSE 100 Talking Points:
- DAX 40 futures attempt to climb above the 13,000 psychological level
- FTSE 100 capped by the moving average providing an additional layer of support just above 7,300
- USD strength and fundamental backdrop remain key for global stock indices

Dax futures have made a minor comeback after the recent slump with FTSE 100 lagging behind.
With the energy crisis weighing heavily on Europe’s largest economy, a breach of the March 2022 low at 12,425 sent German 40 futures lower in July before finding support at 12,367.
Another obvious catalyst for price action has been the strong US Dollar which has been supported by an aggressive Federal Reserve.
Dax Futures Daily Chart
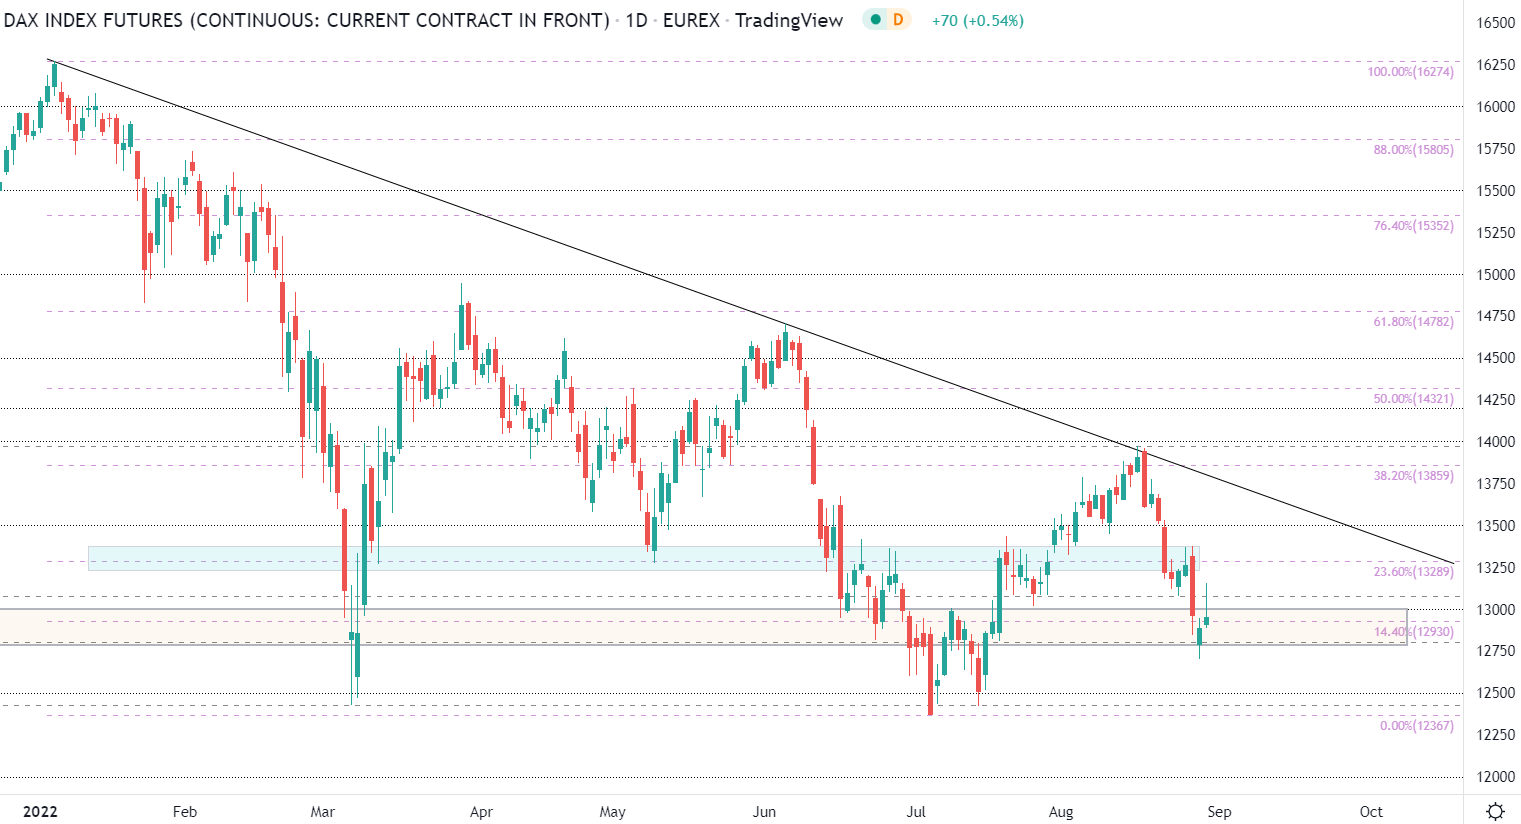
Chart prepared by Tammy Da Costa using TradingView
With a downward trajectory still intact, the 12,930 remains as critical support while resistance stands at 13,289 (Fibonacci levels of the Jan – Jul 2022 move).
On the eight-hour chart, a bounce off the key psychological level of 13,000 may allow for a retest of 13,289 (the 23.6% move of the 2022 move) while the MACD (moving average convergence/divergence) threatens a crossover below the zero-line. This suggests that although the downtrend remains dominant, the bearish move may be losing steam.
Dax Futures Eight-Hour Chart
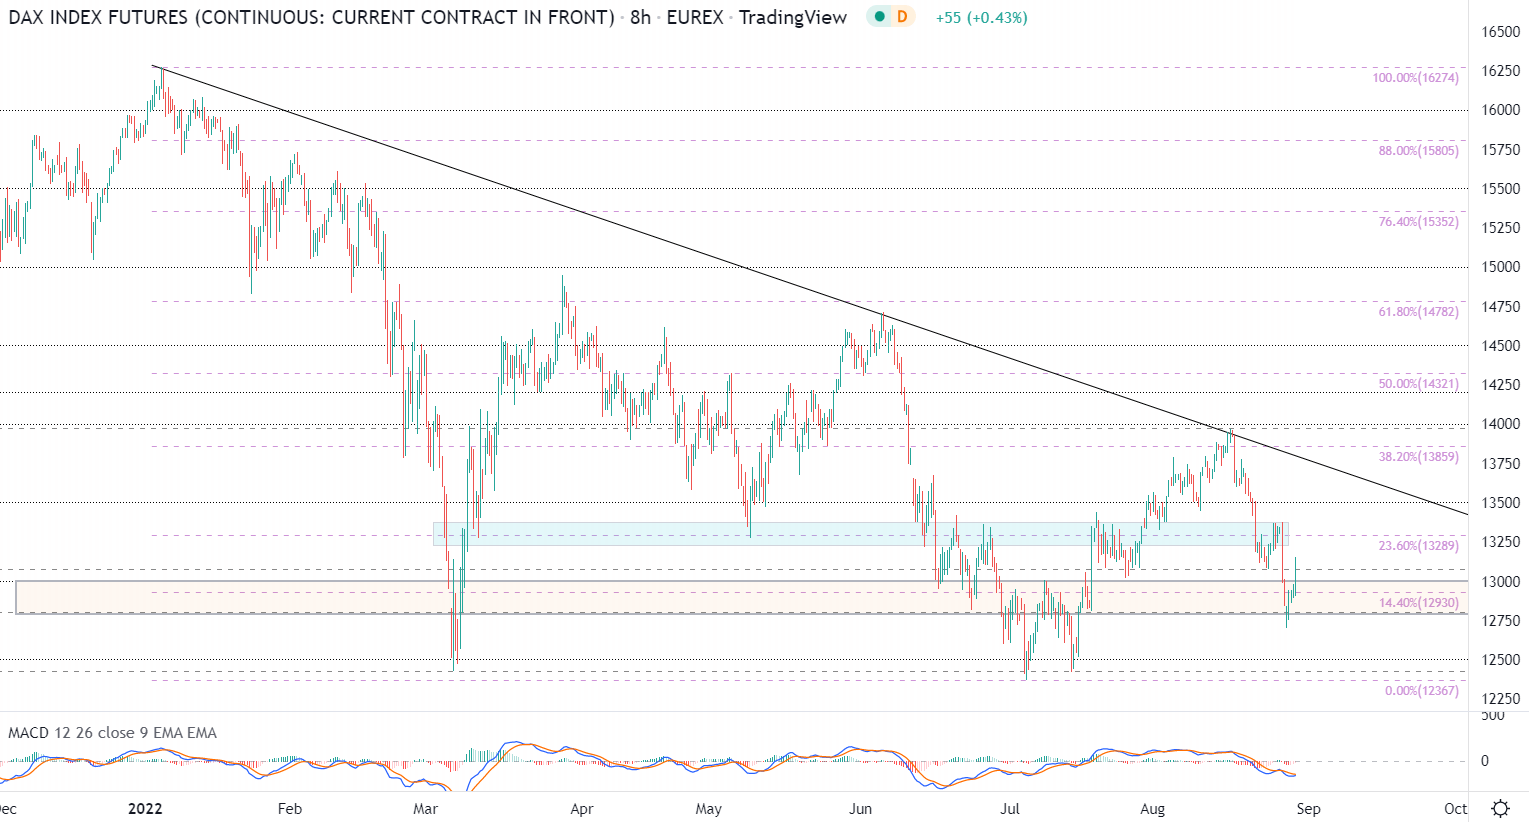
Chart prepared by Tammy Da Costa using TradingView
FTSE 100 Price Action
For FTSE, the UK 100 has found support above the 200-day MA (moving average), capping the downward move at 7,388.
With the MACD (moving average convergence/divergence) crossing above the zero line, the 50-day MA has formed an additional layer of support at 7,325.
Despite a relatively big move in FTSE price action over the past two months, UK stocks remain in a downtrend after the index failed to rise above the June high at 7,646.77.
FTSE 100 Daily Chart
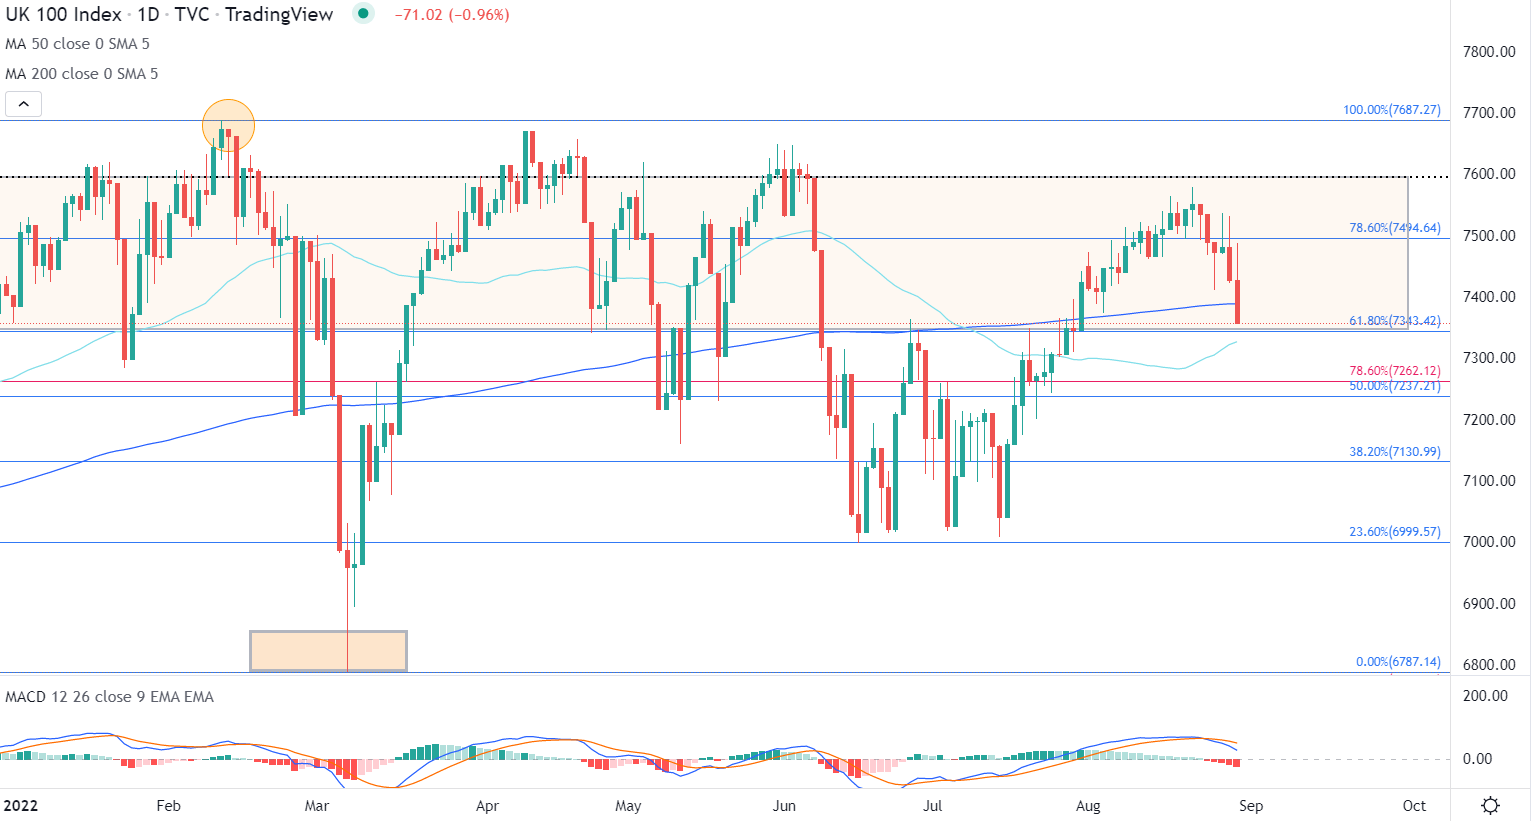
Chart prepared by Tammy Da Costa using TradingView
On a shorter timeframe, a rebound off 7,580 gave bears the opportunity to retest Fibonacci support at the 61.8% retracement of the 2022 move at 7,343. With the MACD preparing to move below the zero line, the 50 MA is providing additional resistance at 7,492.
FTSE 100 Four-Hour Chart
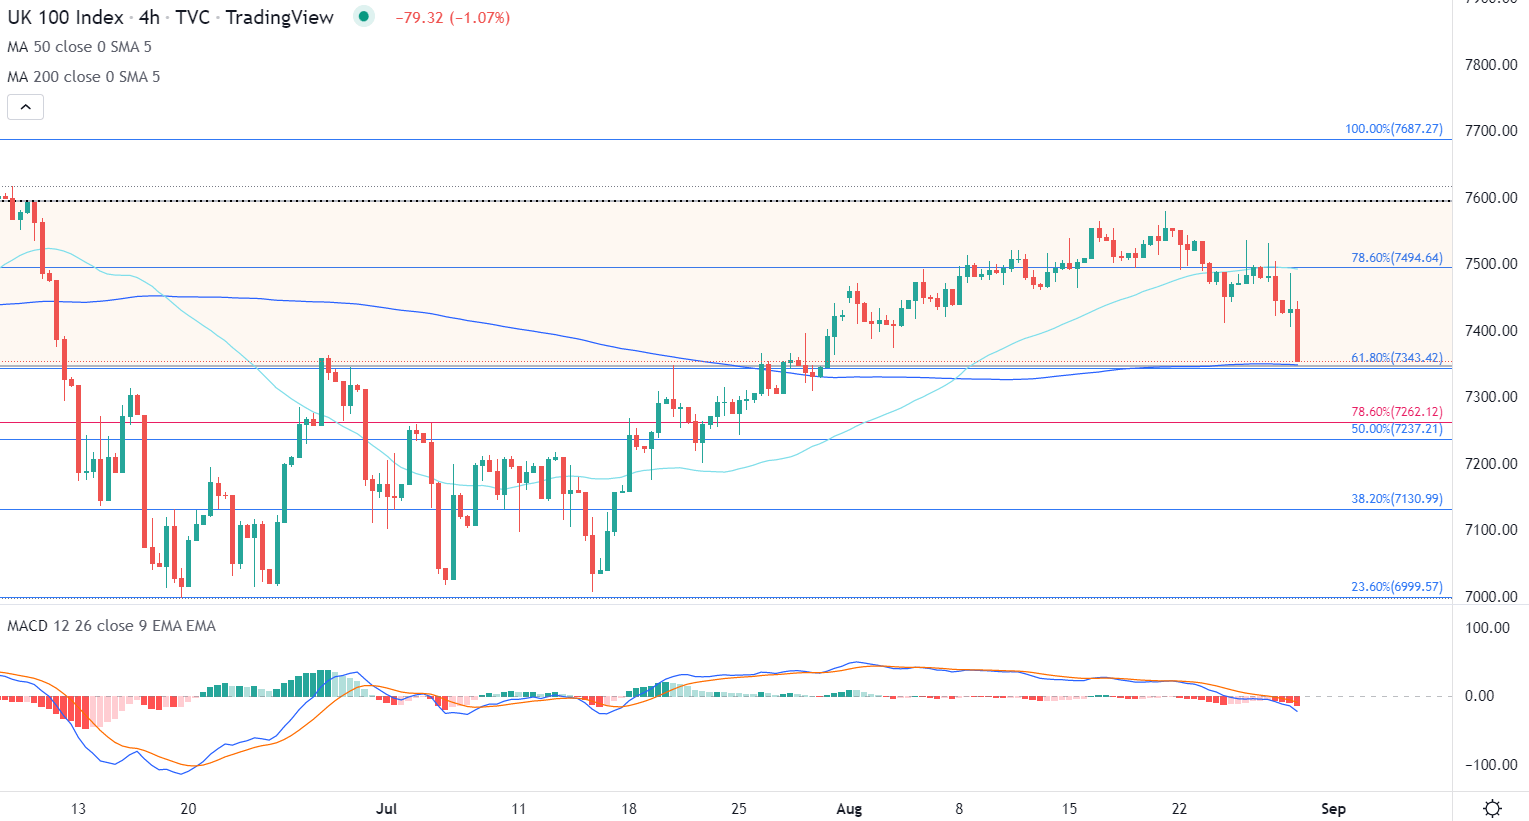
Chart prepared by Tammy Da Costa using TradingView
--- Written by Tammy Da Costa, Analyst for DailyFX.com Contact and follow Tammy on Twitter: @Tams707


