


FTSE 100 Analysis and Talking Points
- Awaiting FTSE 100 Pullback
- China Slowdown Risks Rise

A few days ago, I mentioned a few technical areas of note in the S&P 500 where I would expect the index to struggle to gain further upside traction. Since then, the index has faltered at the 200DMA situated at 4327. Now while we have seen a modest 2% pullback, more work needs to be done before bearish momentum can pick up, such as a break below the late May/early June highs (4180-90).
Elsewhere, I am also keeping a very close eye on the FTSE 100. Unlike its counterparts, the index has essentially in a broad 6800-7600 range throughout the year. However, now that we are approaching the top of that range around 7600-50, this may be a good area to look for a pullback. One of the reasons is the fact that China slowdown risks are coming back to the forefront of investors' minds, keep in mind the FTSE 100 is much more exposed to China than its counterparts given that index heavyweights are within the commodity space. A gauge of Chinese sentiment can be looked at through the lens of FX with the Chinese Yuan. As shown in the chart below, USD/CNH is testing its 2022 peak and thus a firm breakthrough is likely to prompt a fresh wave of risk-off sentiment and I would expect the FTSE 100 to come under pressure.
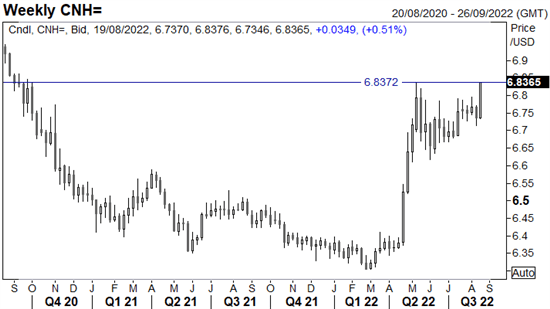
Source: Refinitiv
Now in this next chart, perhaps I might be committing a chart crime here, but here is an overlay of USD/CNH inverted vs the FTSE 100, which shows that USDCNH has tended to fall notably before the FTSE 100. Leading indicator or just a spurious correlation?
FTSE 100 vs USD/CNH Inverted
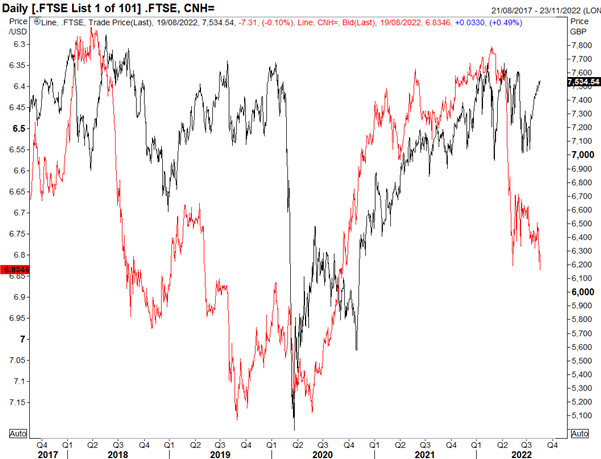
Source: Refinitiv
For those who are patient, the opportune moment could be to await a pullback from 7600-50. My view of looking for the FTSE 100 to drop would be wrong should we close above 7710.
FTSE 100 Chart: Daily Time Frame
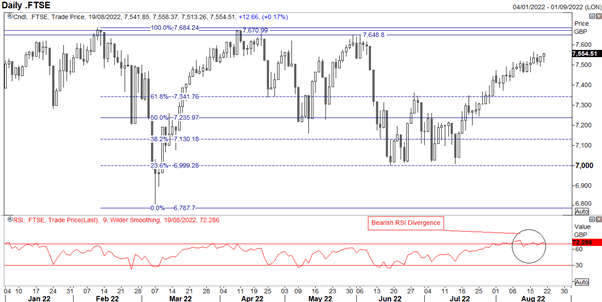
Source: Refinitiv


