


SPX, WMT Analysis and Talking Points
- Walmart beats expectations
- S&P 500 Grinds Higher in Low Vol Environment

A firm set of results from Walmart relative to expectations with the retailer beating consensus on both EPS and revenue. Alongside this, the company expects a smaller decline in annual sales than previously forecast. Keep in mind, that last month the retailer announced a profit warning as rising prices prompted consumers to cut back on discretionary spending.
WMT Q2 Results
- Adj. EPS $1.77 vs Exp. 1.63
- Revenue $152.86bln vs Exp. 151.14bln
- Total US Comp Sales Ex Gas +7% vs Exp. +6.48%
- Sees Year Adj. EPS Decline 9-11%, Previously saw Decline of 11-13%
WMT shares are up 3% pre-market at the time of writing
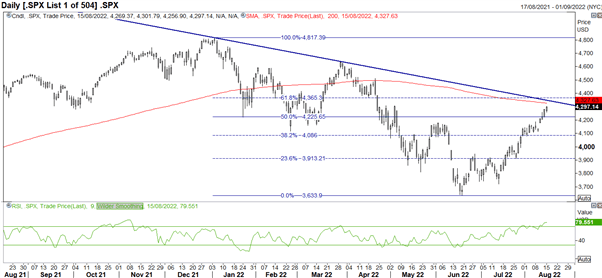
S&P 500 | Where Could the Bear Market Rally Come to a Halt?
While the S&P 500 is up over 17% since the June lows, I remain convinced that this is a bear market rally in the equity space. I assume the question is that if this is a bear market rally, where would I reassess this view and when do I expect a turn lower in the S&P 500. Firstly, the area of interest for me is around the 200DMA (4327) and 55WMA (4355) and with the RSI rising to extreme overbought levels, further gains from here may be hard to come by from here on.
Elsewhere, the key macro catalyst to watch will be the upcoming Jackson Hole Symposium, in which we may see Chair Powell offer guidance on balance sheet reductions, which are expecting to double from next month, while also addressing the so-called Fed pivot chatter.
S&P 500 Chart: Daily Time Frame
| Change in | Longs | Shorts | OI |
| Daily | 2% | -7% | -3% |
| Weekly | 18% | -19% | -4% |


