


FTSE 100 - Prices, Charts, and Analysis
- FTSE 100 prints a fresh two-month high.
- Hanging man candlestick suggests short-term caution.

The FTSE 100 is nudging back to levels last seen in mid-June this year, helped by a rally in mining stocks, after ex-FTSE 100 constituent BHP announced an earnings increase of 26% to USD21.3 billion along with a record dividend payout. BHP shares in London trade 4% higher at 2,326p. Oil majors also nudged higher as the price of brent stabilized after Monday’s sell-off, while takeover fever was boosted by news that Ted Baker and cyber-security firm Darktrace were both takeover targets. Ted Baker is said to have recommended a 110p a share bid from ABG, worth GBP210 million, while US private firm Thoma Bravo is running the numbers on Darktrace.
Ted Baker (TED) shares are 17% higher at 109p, while Darktrace (DARK) shares are 21% higher at 502p.
For all market-moving economic data and events, refer to the DailyFX calendar
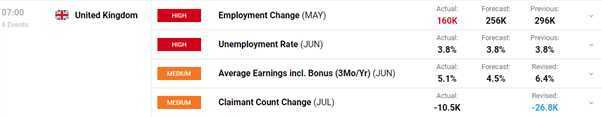
The FTSE 100 made a fresh two-month high in early turnover but is struggling to push further ahead. Positive equity news, a weak Sterling versus the US dollar, and slightly better than expected UK employment and wages news all underpinned today’s move higher.
A lack of any follow-through is causing bulls to question whether the index has run its short-term course. One technical signal, a bearish candlestick, is adding credence to this view. Monday’s ‘hanging man candlestick’ on the daily chart suggests that a reversal of the recent rally is a real possibility.
How to Trade Reversals with the Hanging Man Candlestick
FTSE 100 Daily Price Chart – August 16, 2022
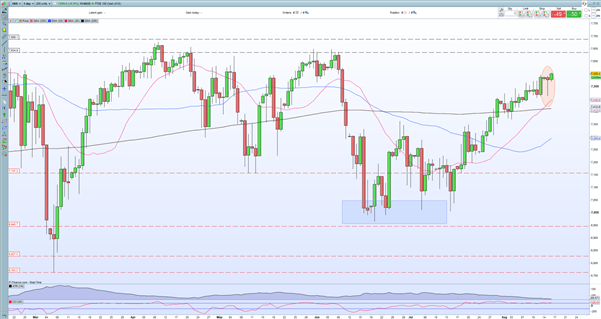
While the hanging man candlestick may cast a negative shadow over the daily chart, the three simple moving averages are looking positive, while a short-term series of higher highs and higher lows remain in place. If the bulls continue to move the market higher, the next target zone for the UK big board resides between 7,634 and 7,688.
Retail trader data show 22.44% of traders are net-long with the ratio of traders short to long at 3.46 to 1. The number of traders net-long is 9.19% higher than yesterday and 9.44% lower from last week, while the number of traders net-short is 2.13% lower than yesterday and 5.48% higher from last week.
We typically take a contrarian view to crowd sentiment, and the fact traders are net-short suggests FTSE 100 prices may continue to rise. Positioning is less net-short than yesterday but more net-short from last week. The combination of current sentiment and recent changes gives us a further mixed FTSE 100 trading bias.
| Change in | Longs | Shorts | OI |
| Daily | -30% | 25% | 2% |
| Weekly | -44% | 44% | 0% |
What is your view on the FTSE 100 – bullish or bearish?? You can let us know via the form at the end of this piece or you can contact the author via Twitter @nickcawley1.


