


GBP/USD - Prices, Charts, and Analysis
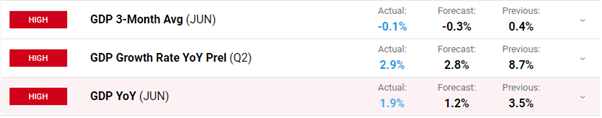
- UK growth data beats market estimates.
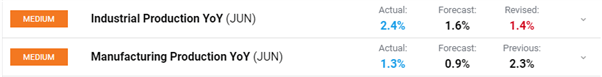
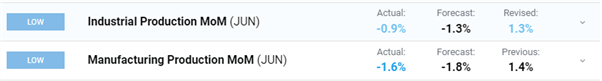
- Industrial and manufacturing production also shine in June.
- Sterling little changed as Europe opens.

Monthly estimates published today by the Office for National Statistics (ONS) show that UK GDP fell by 0.6% in June, following a downwardly revised 0.4% increase in May. According to the ONS, the Platinum Jubilee and the move of the May Bank Holiday led to an additional working day in May and two fewer working days in June.
The three-month average and year-on-year figures also beat market expectations.
UK manufacturing and industrial production data also beat market estimates on both an m/m and y/y basis.
For all market-moving economic data and events, refer to the DailyFX calendar
Trade Smarter - Sign up for the DailyFX Newsletter
Receive timely and compelling market commentary from the DailyFX team
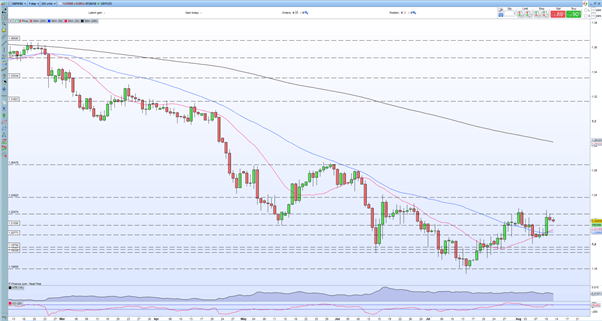
After an initial pop higher, Sterling fell back to trade just under 1.2200 against the US dollar. Sterling remains weak as a currency and is currently stuck in Wednesday’s 1.2062 – 1.2278 bullish candle. The positive 20-day sma/50-day sma crossover suggests that Sterling may push higher, but the rest of the chart is neutral to negative. This afternoon sees the latest University of Michigan consumer sentiment release (14:00 GMT) and this will likely be the next driver for cable.
GBP/USD Daily Price Chart – August 12, 2022
Retail trader data show 66.64% of traders are net-long with the ratio of traders long to short at 2.00 to 1. The number of traders net-long is 10.26% higher than yesterday and 4.81% lower from last week, while the number of traders net-short is 9.45% lower than yesterday and 5.06% lower from last week.
We typically take a contrarian view to crowd sentiment, and the fact traders are net-long suggests GBP/USD prices may continue to fall. Traders are further net-long than yesterday and last week, and the combination of current sentiment and recent changes gives us a stronger GBP/USD-bearish contrarian trading bias.
| Change in | Longs | Shorts | OI |
| Daily | 3% | -7% | -3% |
| Weekly | 4% | -10% | -5% |
What is your view on the British Pound – bullish or bearish?? You can let us know via the form at the end of this piece or you can contact the author via Twitter @nickcawley1.


