


Gold Analysis and News:
- Gold Recovery Facing First Hurdle at 1750-60
- Moving From Peak Hawkishness Bodes Well for Gold

Gold Recovery Facing First Hurdle
A lack of guidance from Fed Chair Powell overnight provided the impetus for Gold to extend recent gains, hitting a two-week high. Alongside this, while the Federal Reserve will continue to raise interest rates, there is a sense that maybe we have moved from peak hawkishness. In turn, this bodes well for gold, particularly on the back of increased recession risks. Gold has been an unloved asset for much of the year and for good reason as real yields have increased notably. However, with the US 10Y real yield now down 50bps from the June peak, funds now net short, the outlook is much more encouraging for gold bugs.
From a technical perspective, the recent recovery in the precious metal is facing its first key test on the topside with resistance situated at $1750-60. While this may cap on its first approach, a break and close above $1760 would be very encouraging, opening the doors towards a move to $1800.
Gold Chart: Weekly Time Frame
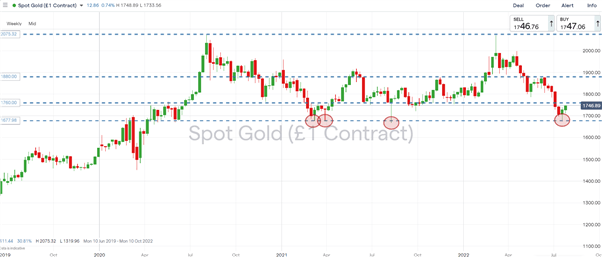
Source: IG
Elsewhere, gold traders will be placing a very close eye on the US 10YR Yield which appears to be showing a head and shoulders pattern, projecting a move to 1.9% should a firm break below 2.7% be realised.
US 10Y Yield Chart: Daily Time Frame
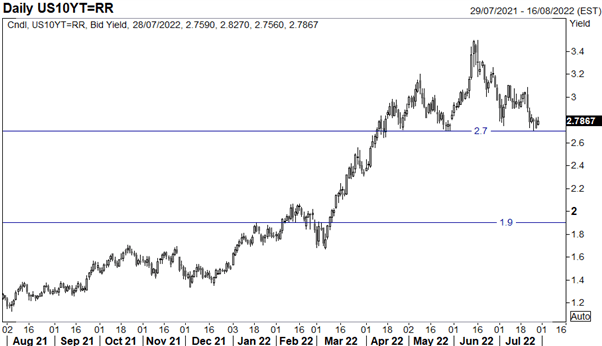
Source: Refinitiv


