


Copper, US Crude (WTI) Oil, Talking Points:
- Copper rebounds from 20-month low but CCI remains in oversold territory.
- Crude Oil (WTI) climbs above $100 despite rising inventories
- Commodity prices remain vulnerable to changes in monetary policy and rising recession fears

Copper Bounces Off Support Amid Hopes of Chinese Stimulus
Commodities are trading higher for the day with both Oil and Copper rebounding off of recent lows. After reaching a fresh all-time high in March, Copper shed over 30% of its gains before bouncing off of Fibonacci support at 3.295.
With lockdowns in China and mounting recession fears weighing on the commodity market, the industrial metal has experienced an immense amount of pressure from demand disruptions, driving prices back to levels last tested in November 2020.
Although the drop in prices may seem steep, Copper rose over 150% from the March 2020 low before peaking at 5.0395 two years later. With Copper now entering its fourth consecutive month of losses, the prospects of additional Chinese stimulus eased fears, driving Copper away from its 20 month low.
As the bearish move temporarily stalls, the monthly CCI (commodity channel index) has fallen below -100, a possible suggestion that the market may be oversold.
Copper Monthly Chart
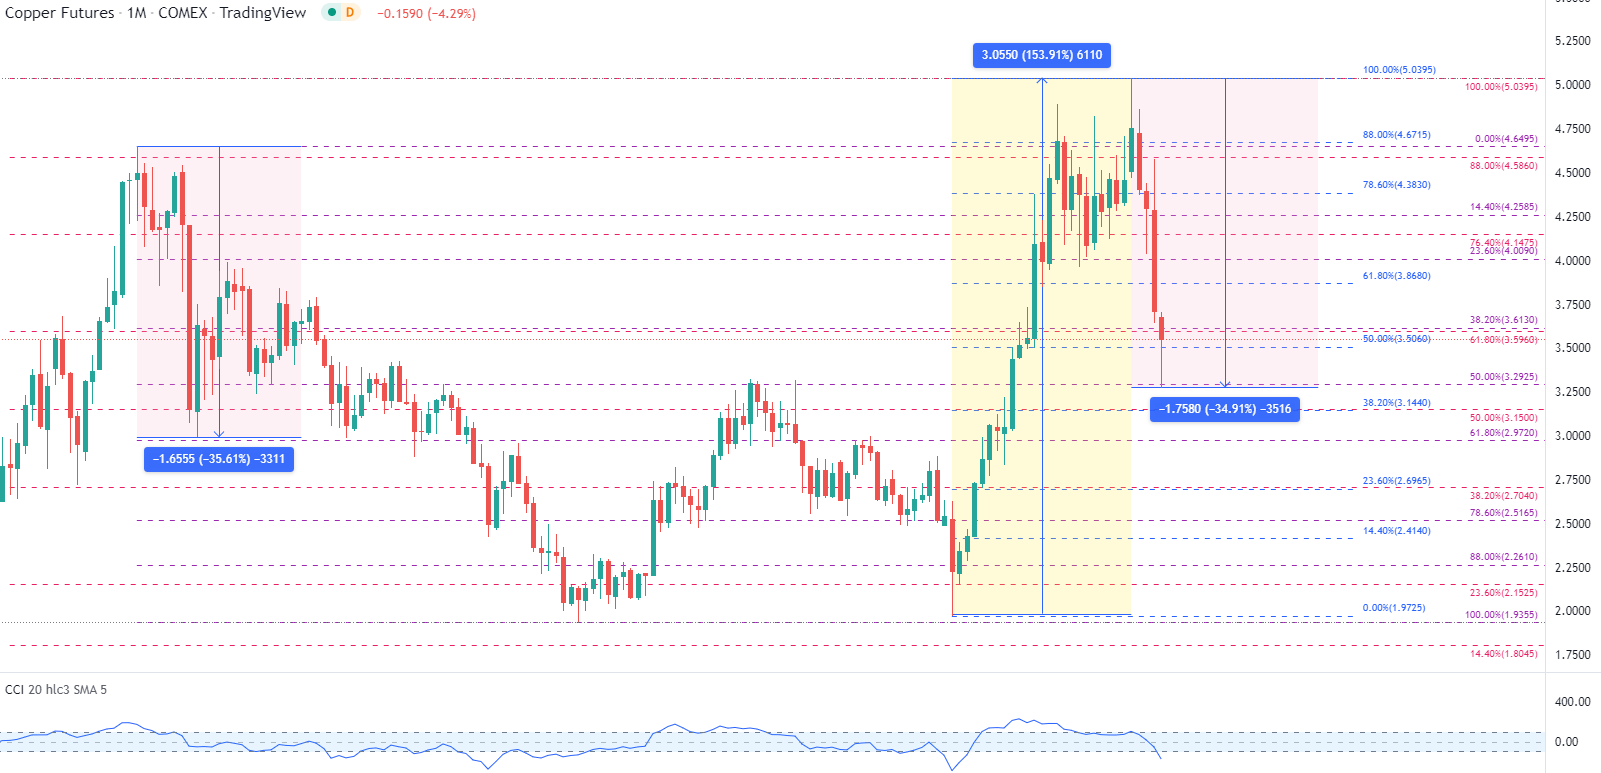
Chart prepared by Tammy Da Costa using TradingView
However, for the short-term move, the potential formation of an evening star (a bearish reversal pattern) is indicative that the bearish move may be running out of steam. If prices rise above 3.613, the January 2021 high of 3.734 may provide additional resistance with a break above leaving the door open for 3.868 (the 61.8% Fib of the 2020 – 2022 move).
Copper Daily Chart
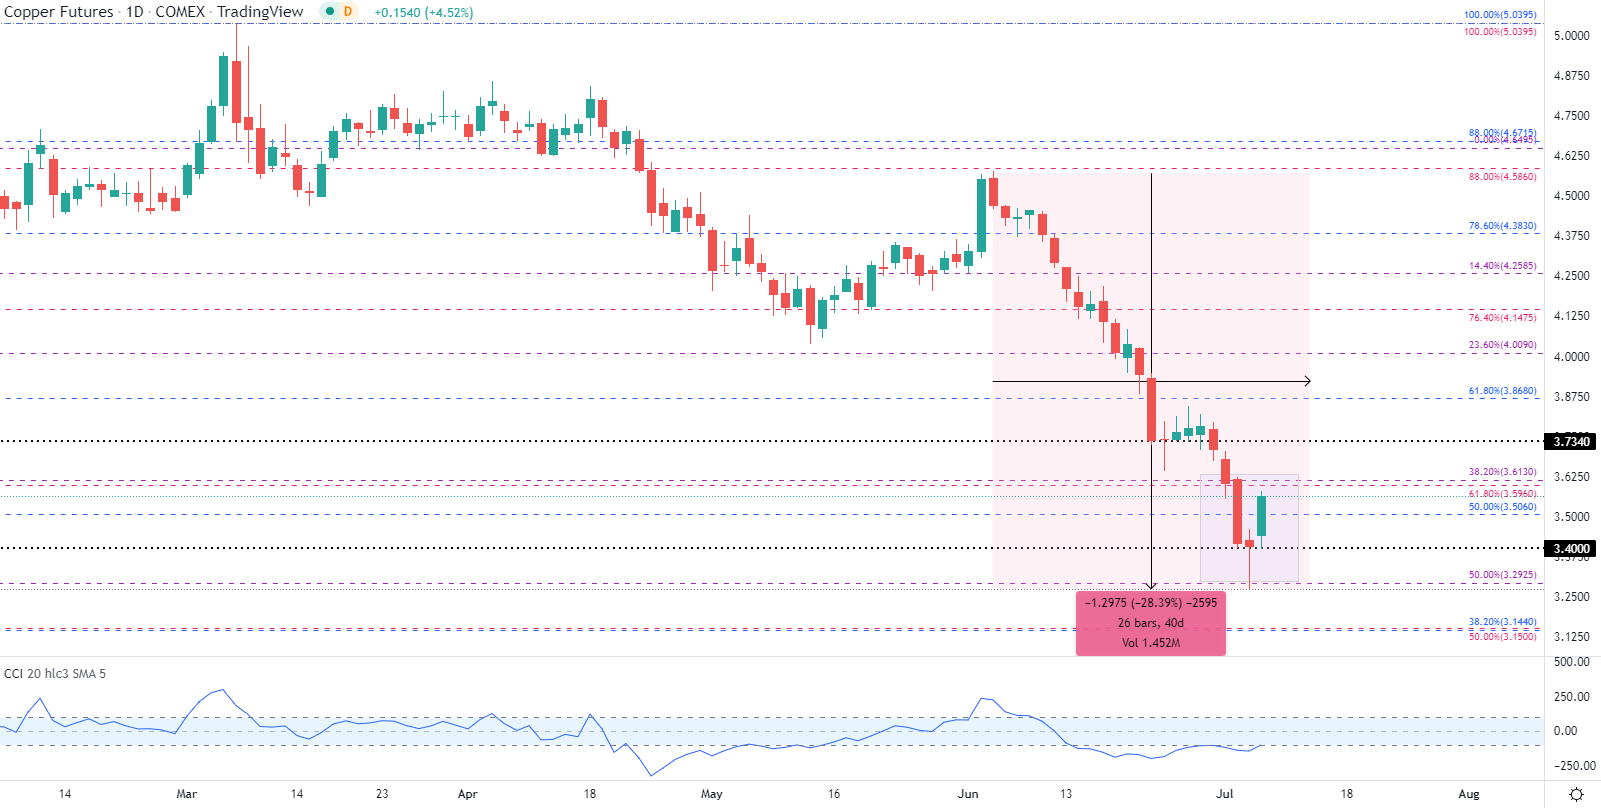
Chart prepared by Tammy Da Costa using TradingView
On the contrary, a break below 3.295 could pave the way for 3.15 (the 50% Fib of the 2008 – 2022 move) with the next level of support holding at 3.00.
Oil Technical Analysis
For US Crude (WTI), failure to hold above the $120 psychological level allowed Oil bears to drive prices lower before finding support at $108.
With a huge zone of technical support and resistance holding firm, sellers would need to gain traction below $93.50 and towards $88.39 (76.4% Fib of 2014 – 2016 move) before claiming a change in the direction of trend.

US Crude Oil (WTI) Daily Chart
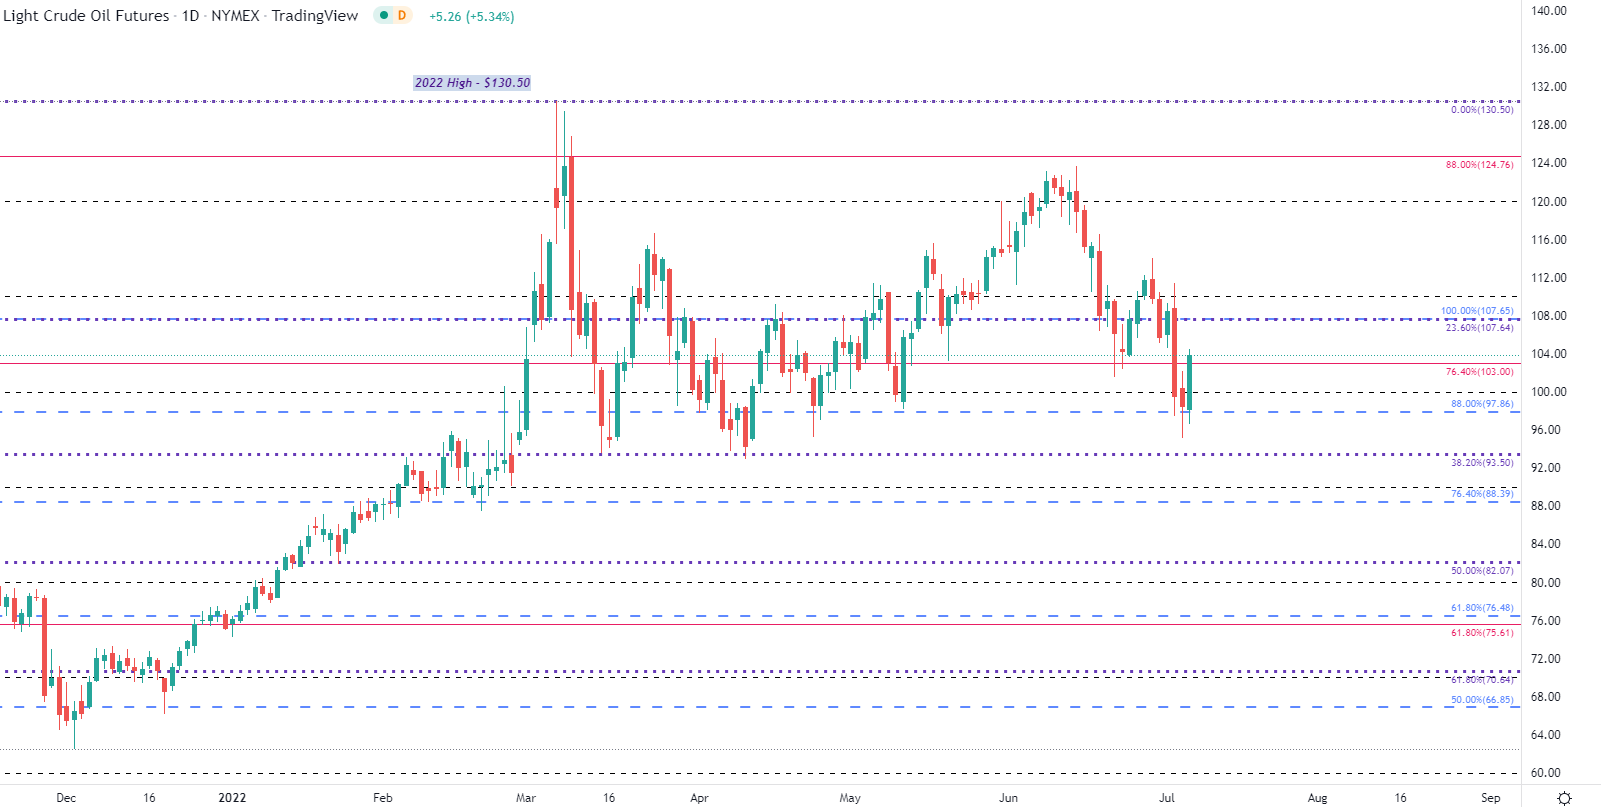
Chart prepared by Tammy Da Costa using TradingView
--- Written by Tammy Da Costa, Analyst for DailyFX.com
Contact and follow Tammy on Twitter: @Tams707


