


- DAX 40: Edges Higher Despite Lackluster German Trade Data.
- FTSE 100: Gains as Energy Stocks Lead the Way.
- DOW JONES: Flat as the US Celebrates Independence Day.
Trading Strategies and Risk Management
Global Macro
Recommended by Zain Vawda
DAX 40: Edges Higher Despite Lackluster German Trade Data
The Dax opened higher in European trade before trimming gains as the session wore on. Germany reported its first monthly trade deficit in three decades after exports fell unexpectedly in May with the German economy heavily focused on exports.The shortfall of €1bn was the first since 1991, with cross-border sales declining 0.5%. Meanwhile, imports rose by a higher than anticipated 2.7%.
The number highlights the disruption sparked by Russia's invasion of Ukraine and China's continued pandemic lockdowns. The German economy minister, Robert Habeck, told German media last week that the government feared Russia would decline to reopen the Nord Stream 2 pipeline, a move that could cause energy shortages over the winter. In such an event, energy prices would come under more pressure pushing the Eurozone further towards a recession.
The sectoral breakdown remains mixed with utilities and financials leading the way while real estate lags in the red, posting losses of 1.9%.
Customize and filter live economic data via our DailyFX economic calendar
DAX 40 Daily Chart - July4, 2022
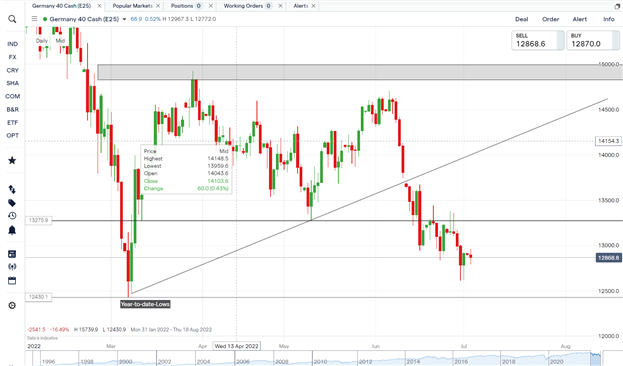
Source: IG
From a technical perspective, last week finally saw a weekly candle close below the key psychological 13000 level. The daily candle however, closed as a hammer while at the same time a potential tweezer bottom formation which in theory should signal more upside to come. We are yet to test the year-to-date lows indicating downside price pressure remains.
Key intraday levels that are worth watching:
Support Areas
- 12600
- 12430
- 12031
Resistance Areas
- 13000
- 13275
- 13600
Introduction to Technical Analysis
Time Frame Analysis
Recommended by Zain Vawda
FTSE 100: Gains as Energy Stocks Lead the Way
The FTSE started the week in the green as investors settle into trading and markets find composure after a torrid first half of the year. The blue-chip index was boosted by oil stocks as crude prices pushed higher amid supply concerns.The index was lifted by energy stalwarts Harbour Energy Plc, BP Plc, and Shell Plc, which rose 4.1%, 3.9%, and 3.8% respectively.
Keeping pressure on the index, the UK faces its own gas challenge as planned strikes in Britain’s biggest supplier of the fuel compound Moscow’s pipeline cuts. UK firms are set to raise prices further according to the British Chamber of Commerce (BCC) further exacerbating the cost-of-living crisis. The BCC warned that "red lights were starting to flash" on its economic dashboard.
Introduction to Technical Analysis
Support and Resistance
Recommended by Zain Vawda
FTSE 100 Daily Charts - July 4, 2022
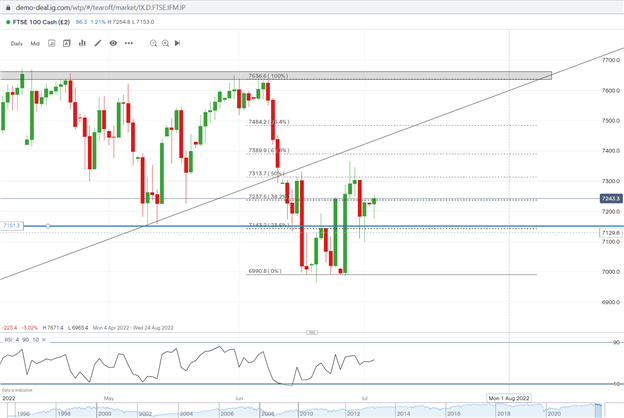
Source:IG
The FTSE bounced off the support area 7080 on Friday before closing as a hammer, while the weekly candle closed indecisive.
Friday’s close was just below the 38.2% fib level with a break above today potentially opening up a retest of the trendline and 61.8% fib level around the 7390 area. With the weekly candle indecisive and the fundamental outlook price remains pressured to the downside.
Key intraday levels that are worth watching:
Support Areas
- 7080
- 6990
- 6870
Resistance Areas
- 7197
- 7284
- 7400
| Change in | Longs | Shorts | OI |
| Daily | 16% | -7% | -4% |
| Weekly | -25% | 5% | -2% |
DOW JONES: Flat as the US Celebrates Independence Day
The Dow opened lower in premarket trade on Independence Day before rallying to trade flat. Activity will be limited Monday, given the July 4th holiday in the United States, and ahead of the keenly awaited monthly U.S. employment report. Recent economic data has added to signs that the U.S. economy, a key global growth driver, is cooling amid aggressive policy tightening by the Fed, so Friday’s nonfarm payrolls report will be studied carefully for how the labor market is performing, given the Fed’s inflation/employment mandate.
Dow Jones Daily Price Chart July 4, 2022
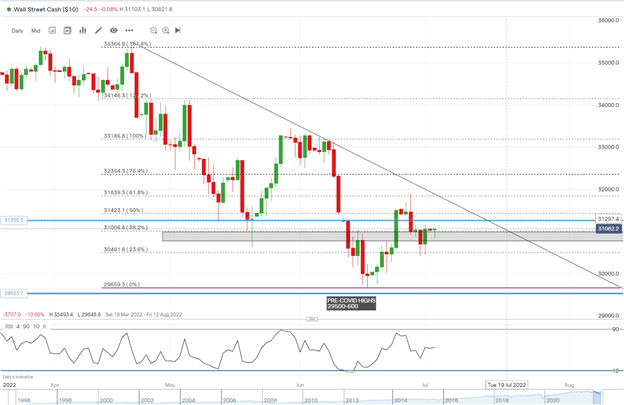
Source: IG
From a technical perspective, we pushed below our key psychological area 31000 (grey box on the chart) and had a daily candle close below. However, the downside was capped as we bounced off the 23.6% fib level on Friday closing as a bullish engulfing candlestick. Price remains pressured, and we currently trade back above the 31000 level. Today’s US holiday could bring lower volatility, however a break higher could see us test trendline resistance which lines up with the 61.8% fib level.
Key intraday levels that are worth watching:
Support Areas
- 30500
- 30000
- 29500
Resistance Areas
- 31420
- 31850
- 32200
| Change in | Longs | Shorts | OI |
| Daily | 16% | -2% | 6% |
| Weekly | 22% | -10% | 2% |
Written by: Zain Vawda, Market Writer for DailyFX.com
Contact and follow Zain on Twitter: @zvawda


