


RAND TALKING POINTS
- Rand subject to global factors.
- Commodity prices helping ZAR upside.
- Charts show USD/ZAR consolidating…waiting for stimulus.
USD/ZAR FUNDAMENTAL BACKDROP
The South African rand has been weakening this week after last week’s risk on sentiment propelled the Emerging Market (EM) currency against the USD, GBP and EUR respectively. Rand-linked commodity exports also remained relatively elevated, further augmenting the move higher.
This week, global recessionary fears via declining growth forecasts may be creeping back in making riskier currencies like the ZAR unappealing to investors – with safer assets being the preferred choice at this point in time. While China continues to face economic growth concerns and damaging COVID-19 policies, the rand is not in the most favorable position. Despite this, the rand is currently one of four currencies that have appreciated against the dollar year-to-date (see graphic below).
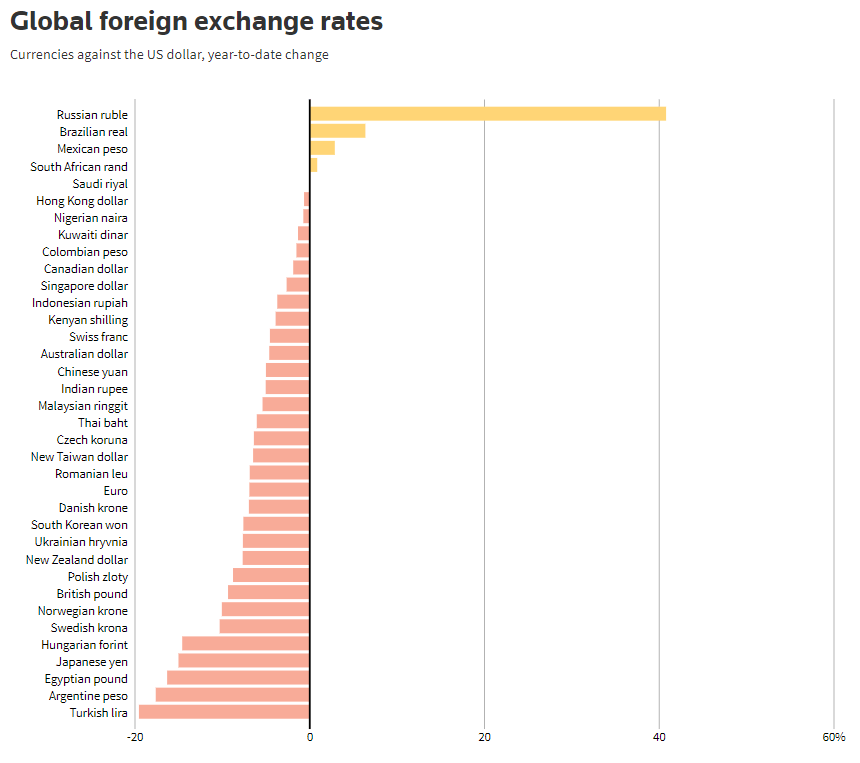
Source: Reuters
The USD will remain buoyed throughout 2022 in my opinion as the fundamental tailwinds for the dollar significantly outweigh any tailwinds within this time frame. South Africa may be on a tightening cycle but the local economy is by no means capable of handling continued front loading of rates relative to the United States however, China’s demand for commodities may help steady the ship for the rand should they come back online to prior levels.
On the local front, rolling blackouts have increased inn frequency which is harming South African businesses and has been reflected by the lowest level of foreign on South African bonds in a decade. Declining investor confidence is negative for the rand and the local power utility Eskom will need to find solutions fast.
TECHNICAL ANALYSIS
USD/ZAR DAILY CHART
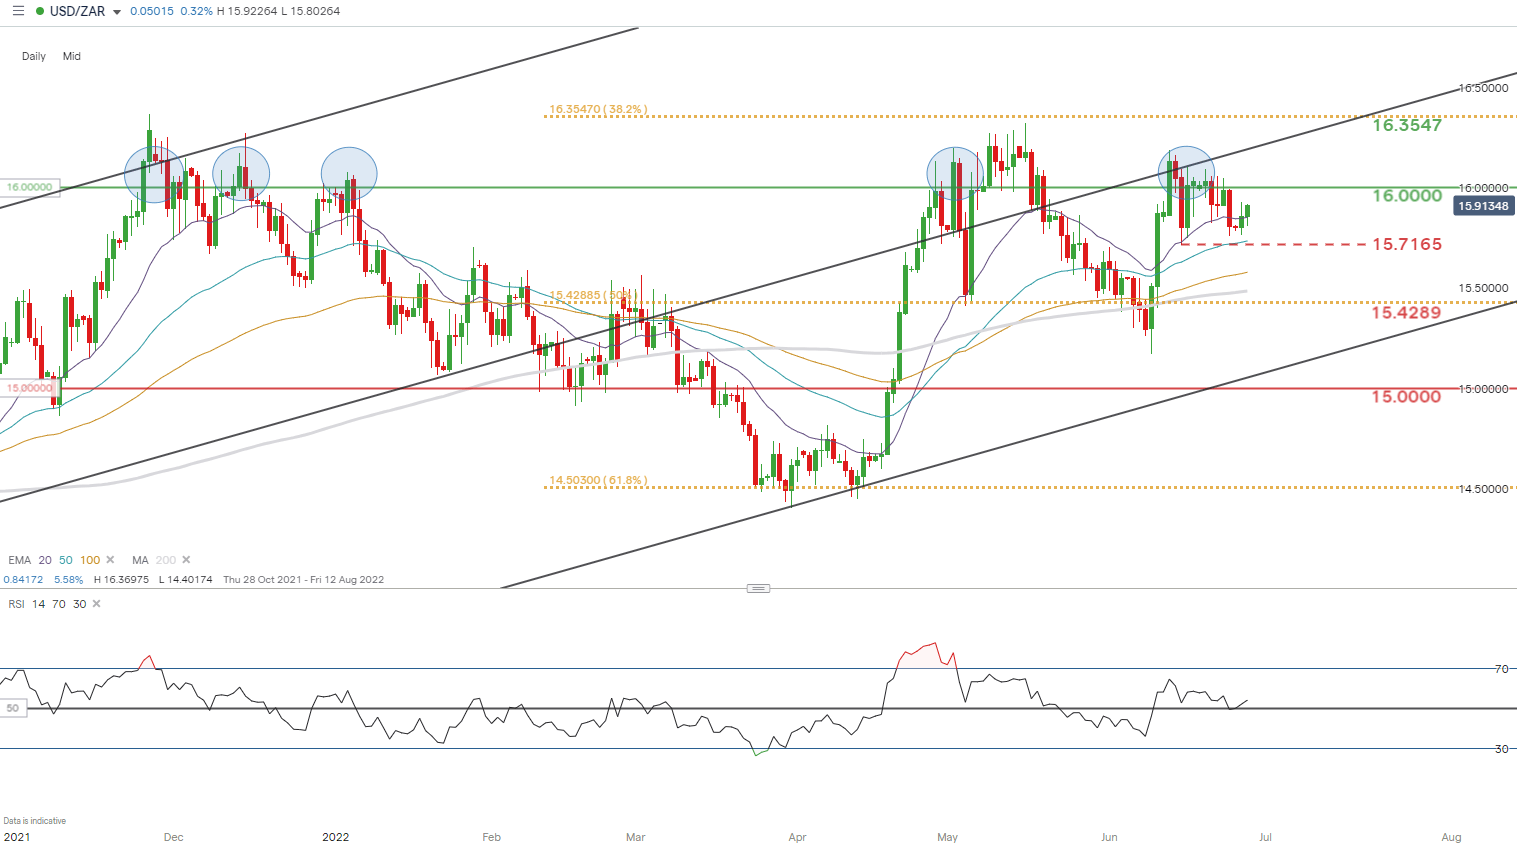
Chart prepared by Warren Venketas, IG
Daily USD/ZAR price action shows the pair sandwiched between the recent June swing low at 15.7165 and the key psychological resistance zone at 16.0000. The rand has been at the mercy of risk-on & risk-off sentiment of recent and will continue to play to this tune going froward as the world grapples with recession fears, inflation, the war in Ukraine and monetary policy guidance. Uncertainty in many of these spheres is reflected by the Relative Strength Index (RSI) which sits around the 50 mark (indicative of market indecision). While we wait for a fundamental catalyst, I believe we will continue to see this range bound move between the aforementioned support and resistance zones.
Resistance levels:
- 16.0000
Support levels:
- 20-day EMA (purple)
- 15.7165/50-day EMA (blue)
- 100-day EMA (yellow)
- 200-day SMA (silver)
- 15.5289
Trade Smarter - Sign up for the DailyFX Newsletter
Receive timely and compelling market commentary from the DailyFX team
Contact and follow Warren on Twitter: @WVenketas


