


GBP/USD - Prices, Charts, and Analysis
- Final UK GDP reading is the only real data of note.
- US weakness may allow cable to drift higher.

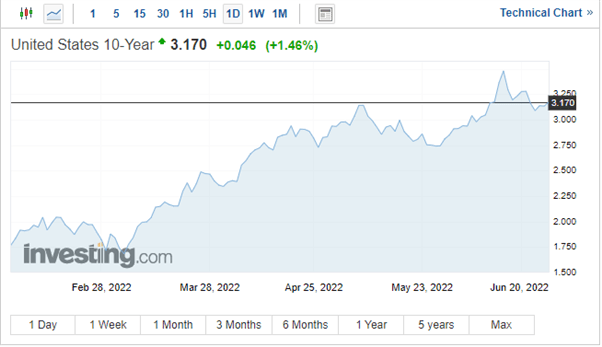
A slow start in European trade today with investors still deciding if last week’s risk-on rally was justified by changing fundamentals or just a bear market rally after months of heavy losses. The changing narrative away from inflation concerns to recession fears is weighing on the US dollar via lower US Treasury yields. While the greenback will retain some underlying strength, limiting any downside it is getting harder to see the USD pushing appreciably higher, even against the Japanese Yen. Ten-year US Treasuries currently yield 3.17% and look likely to remain within a 3.00% to 3.48% range for now.
For all market-moving economic data and events, refer to the DailyFX calendar
The British Pound remains fairly listless despite further political woes for the gaff-prone PM Boris Johnson. The PM is struggling to keep the keys to No.10 Downing Street, despite saying over the weekend that he wants to run for three terms, with a growing number of Conservative MPs fed up with the PM’s behavior. However, with no real challenger seen as yet, the PM looks likely to hold onto power for the coming months at least.
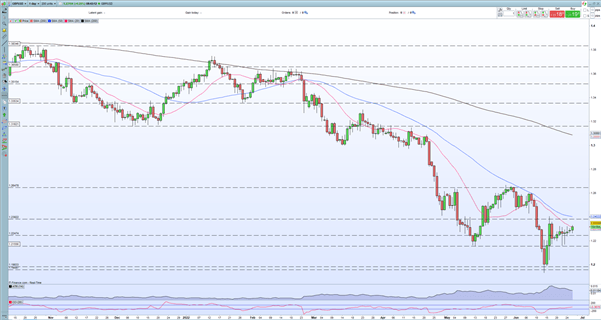
GBP/USD is trading either back above 1.2300 and is continuing its drift higher from the June 14 low at 1.1934. The daily chart shows the June 16 engulfing candle -1.1990/1.2406 – containing current price action and this is likely to remain the case in the short term. Cable is nearing in on both the 20- and 50-day simple moving averages and these may also prove difficult to break with any conviction.
Trade Smarter - Sign up for the DailyFX Newsletter
Receive timely and compelling market commentary from the DailyFX team
GBP/USD Daily Price Chart – June 27, 2022
Retail trader data show 70.06% of traders are net-long with the ratio of traders long to short at 2.34 to 1. The number of traders net-long is 0.23% higher than yesterday and 2.84% lower from last week, while the number of traders net-short is 0.52% lower than yesterday and 25.04% higher from last week
.
We typically take a contrarian view to crowd sentiment, and the fact traders are net-long suggests GBP/USD prices may continue to fall. Positioning is more net-long than yesterday but less net-long from last week. The combination of current sentiment and recent changes gives us a further mixed GBP/USD trading bias.
| Change in | Longs | Shorts | OI |
| Daily | 3% | -7% | -3% |
| Weekly | 4% | -10% | -5% |
What is your view on the British Pound – bullish or bearish?? You can let us know via the form at the end of this piece or you can contact the author via Twitter @nickcawley1.


