


GBP/USD - Prices, Charts, and Analysis

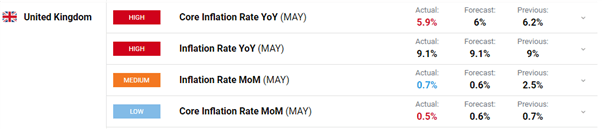
Price pressures in the UK remain inflated and at multi-decade highs. The latest inflation report from the Office for National Statistics (ONS) shows annual headline inflation at 9.1%, in line with market expectations, while monthly inflation rose by 0.7%. The annual figure is the highest reading since the series began in 1997.
Core inflation fell in May to 5.9% y/y from 6.2% in the prior month. The CPI index including owner occupier’s housing costs (CPIH) rose by 7.9% in the 12 months to May 2022, up from 7.8% in April.
For all market-moving economic data and events, refer to the DailyFX calendar
Today’s data will keep pressure on the Bank of England to hike rates aggressively. The Bank of England (BoE) recently warned that inflation could hit 11% this year before turning lower. The UK central bank will need to balance how to keep the economy expanding at the same time as pushing down on inflation.
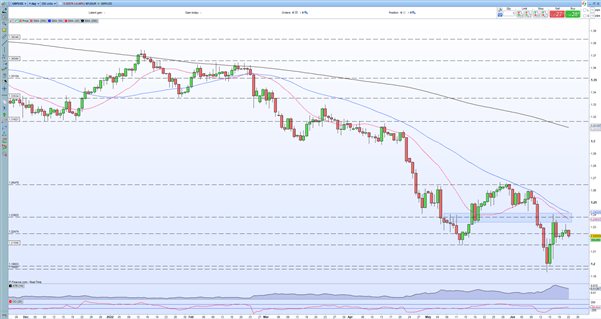
GBP/USD remained little changed to marginally lower, due mainly to US dollar strength. Later today we have the first of Fed chair Jerome Powell’s testimony and this is likely to be the main driver of today’s price action. GBP/USD still remains within last Thursday’s bullish candle – 1.2040/1.2405 – while a zone of resistance around 1.2340 will provide initial resistance.
Trade Smarter - Sign up for the DailyFX Newsletter
Receive timely and compelling market commentary from the DailyFX team
GBP/USD Daily Price Chart – June 22, 2022
Retail trader data show 71.25% of traders are net-long with the ratio of traders long to short at 2.48 to 1. The number of traders net-long is 2.28% lower than yesterday and 14.38% lower from last week, while the number of traders net-short is 10.21% higher than yesterday and 48.41% higher from last week.
We typically take a contrarian view to crowd sentiment, and the fact traders are net-long suggests GBP/USD prices may continue to fall. Yet traders are less net-long than yesterday and compared with last week. Recent changes in sentiment warn that the current GBP/USD price trend may soon reverse higher despite the fact traders remain net-long.
| Change in | Longs | Shorts | OI |
| Daily | 3% | -7% | -3% |
| Weekly | 4% | -10% | -5% |
What is your view on the British Pound – bullish or bearish?? You can let us know via the form at the end of this piece or you can contact the author via Twitter @nickcawley1.


