


S&P 500, US Bond Yields, Oil Analysis and Talking Points
- Percentage of Stocks Within S&P 500 Above Its 50DMA at Historical Lows
- Short-Term Outlook A Little Less Bearish for Stocks and Bonds as Oil Dips

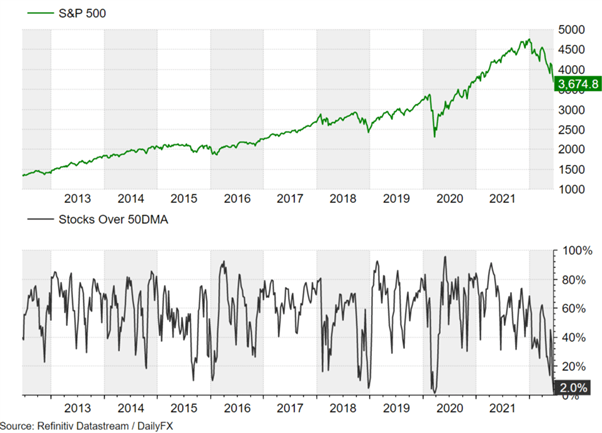
The S&P 500 is down over 23% from its peak, meaning the index is now in bear market territory. Looking into more granular details and as flagged by many analysts across FinTwit (financial analysts on Twitter), the number of stocks within the S&P 500 above its 50DMA (figure 1.) is now sub 2%, which is a rare occurrence, having happened on only four prior occasions since 2000.
Date of Sub 2% of Stocks Above 50DMA
- 22/07/02
- 07/10/08
- 24/12/18
- 20/03/20
Percentage of Stocks Within S&P 500 Above Its 50DMA at Historical Lows
Short-Term Outlook A Little Less Bearish for Stocks and Bonds as Oil Dips
Now while I am of the view that equities remain a sell-on rallies, the returns on the S&P 500 after the number of stocks above its 50DMA falls below 2% is generally positive as shown in the table. That said, I have to acknowledge that the sample size is very small. However, with oil prices continuing to pull back, the near-term outlook for equities and bonds has gotten a little less bearish.
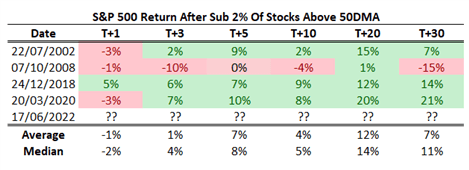
Source: DailyFX, Refinitiv. T+1 = 1-Day After Sub 2% of Stocks Above 50DMA

Bond Yield Peak – Are We There Yet?
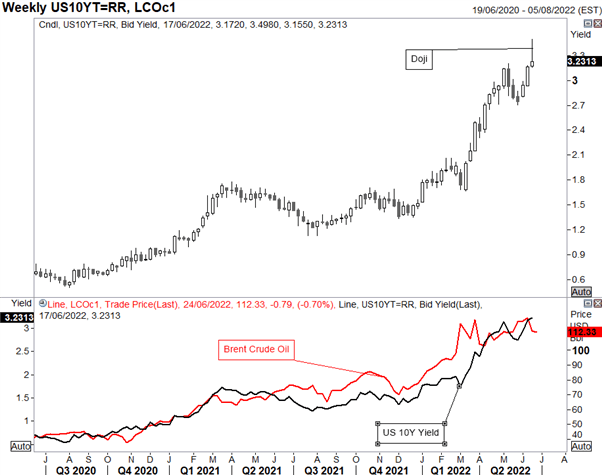
Last week the US 10YR firmly broke through its prior cycle high of 3.26%, soaring to 3.5% with traders panicking after the WSJ reported that the Fed would look to raise rates by 75bps following the poor inflation data. Since the Fed meeting however, the US 10YR has dropped over 20bps, now forming a weekly doji candle, an indication that rates may have peaked in the short-run. Alongside this, with oil prices heading lower, this bodes well for bonds and would be a signal for lower yields.
How to Trade the Doji Candlestick Pattern
US 10Y Yield, Brent Crude Oil Chart
Source: Refinitiv


